


I am a big fan of Relative Rotation Graphs (RRGs), as they provide a great visualization of the rotation occurring within the market.
RRGs measure momentum and relative strength vs. a benchmark (such as the S&P 500 or cash).
The areas with the strongest positive momentum and relative strength are found in the green upper-right quadrant, while the weakest is found in the red, lower-left quadrant:
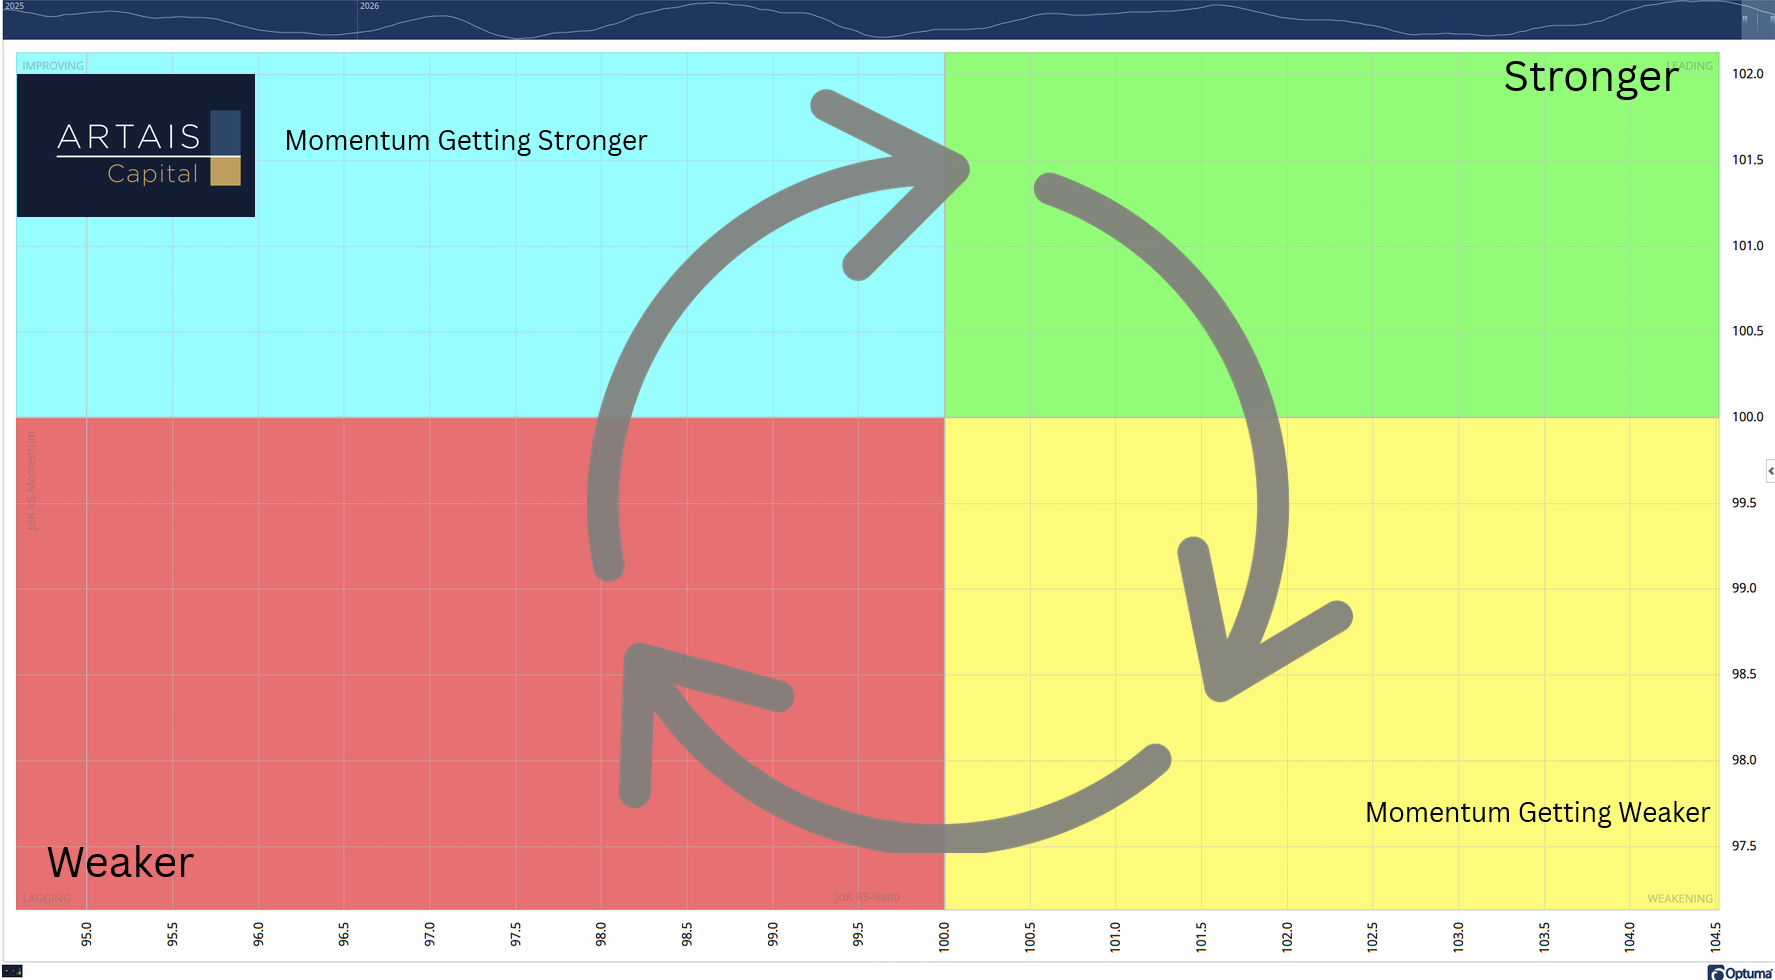
In a typical market cycle, the components (index, ETF, stock, etc.) rotate in a clockwise fashion. In my research, I have found opportunities in the blue upper-left quadrant. This is where momentum has turned positive and relative strength is improving.
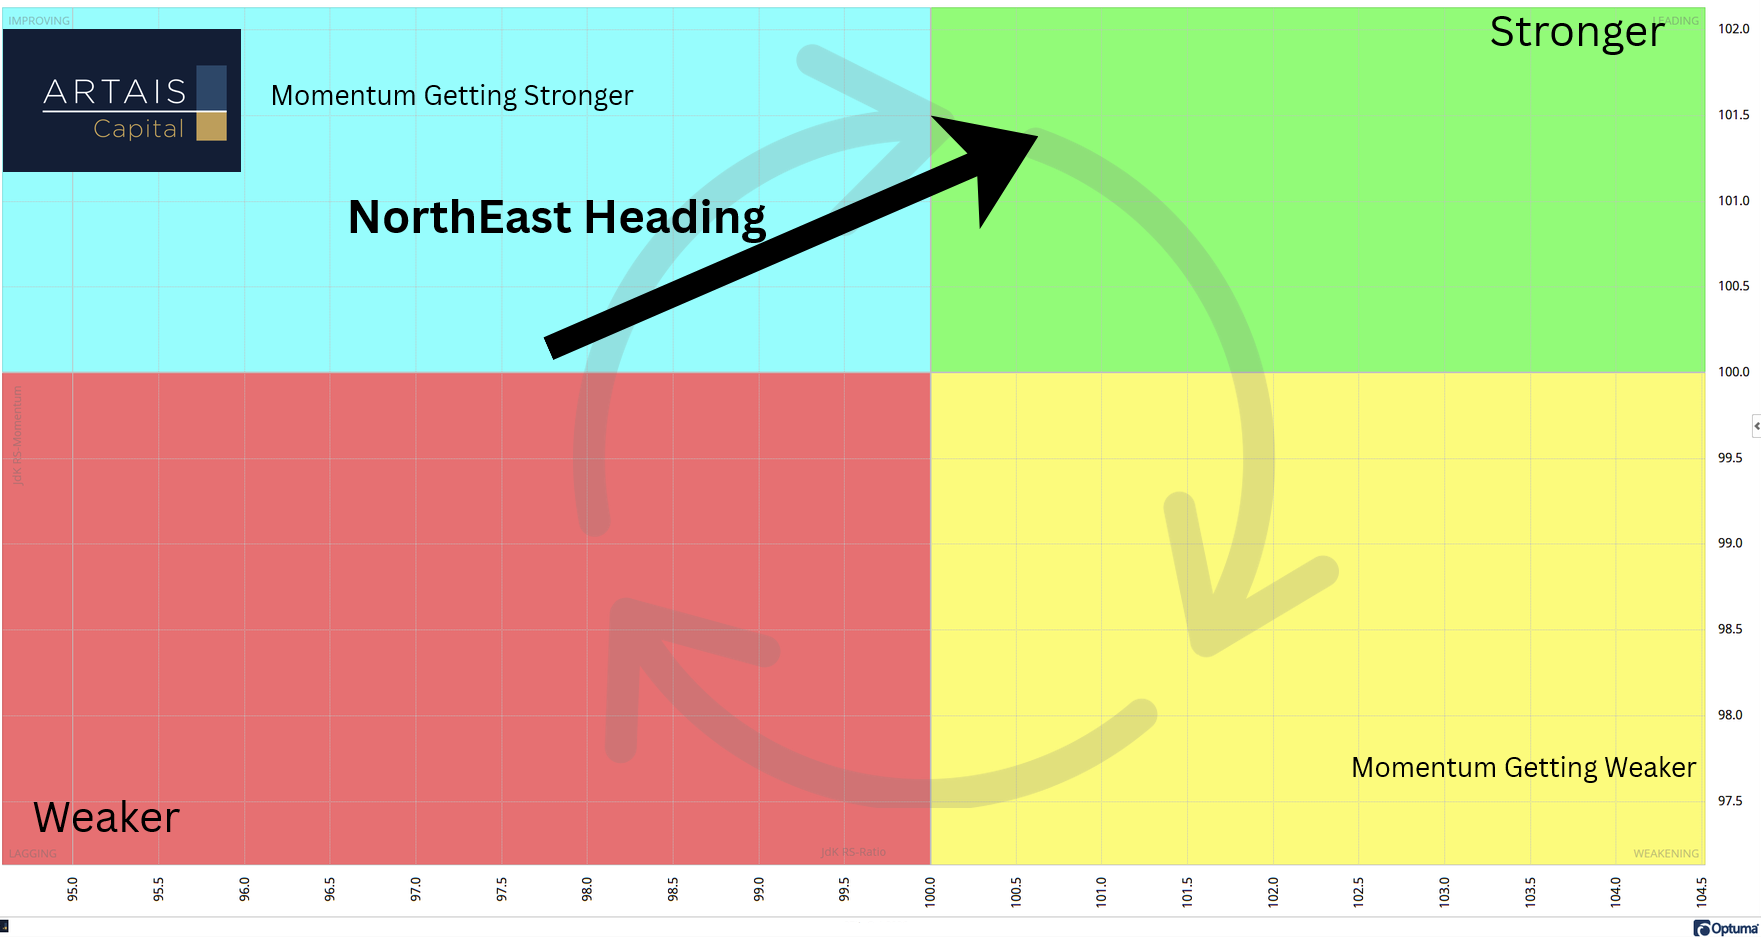
I also watch for the direction the component is heading. A northeast heading indicates that both momentum and relative strength are improving:
The Current Macro Picture
Below is an RRG of the various macro ETFs I follow to get an overview of how investors are allocating their portfolios and which themes they are rotating into or away from:
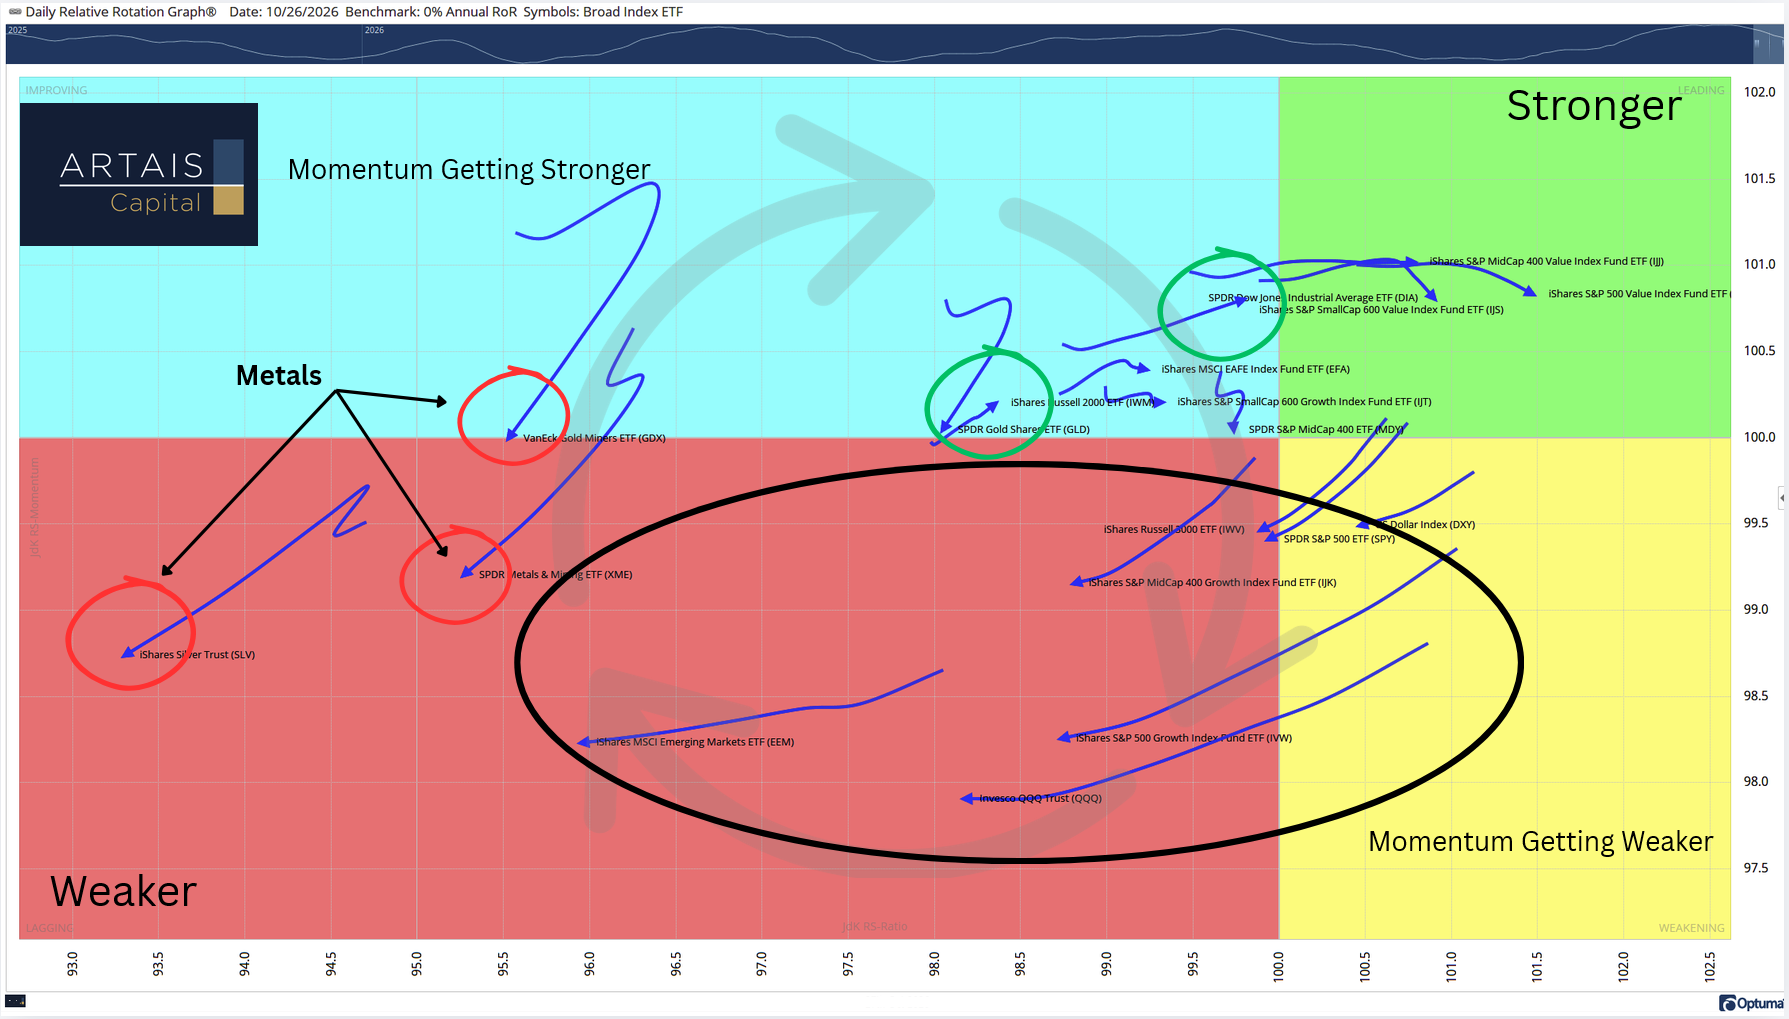
Metals are showing the weakest levels of upside momentum and relative strength, while small caps are showing the strongest.
The data below shows the individual ETFs from the above RRG chart, which quadrant they are in, and what their current heading is.
The following section is for paid subscribers:
Which areas of the market are improving and which are not
Current rotation vs the longer-term trend
Today’s ARTAIS AI Theme screen results, updated every trading day