


Since last week’s midterm election, US markets have been dealing with typical post-midterm volatility as market participants readjust their portfolios to align with potential policy changes under a Democrat-led Congress.
Based on historical election-cycle patterns, the S&P 500 should begin to rally as we approach the end of the year and continue to rise next year:
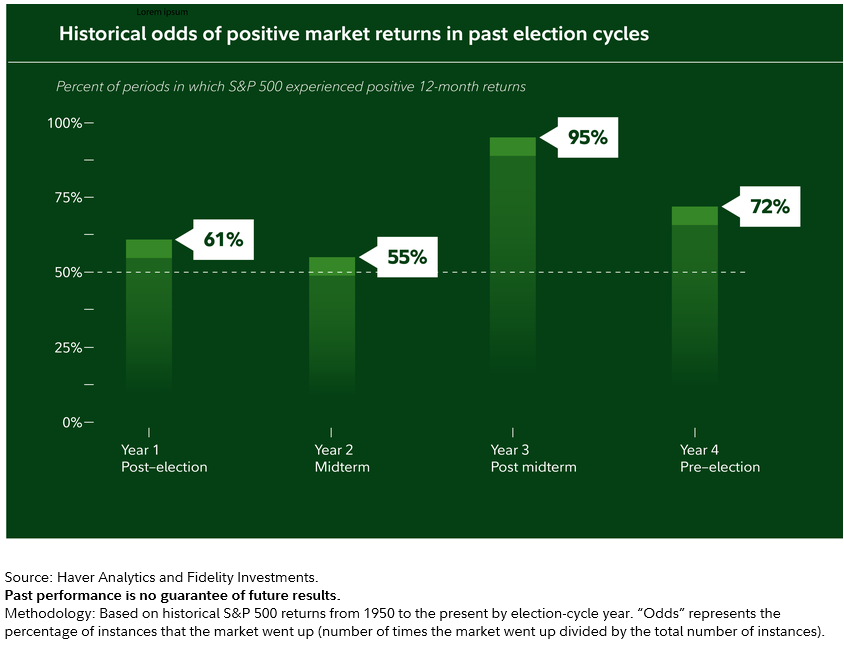
When Will The Volatility End?
For indications that we are getting past this period of volatility, I have been watching technology stocks.
Why tech stocks? Well, one would assume that if investors are positioning for a year-end rally, they will want to own high-beta names - like tech stocks, for example.
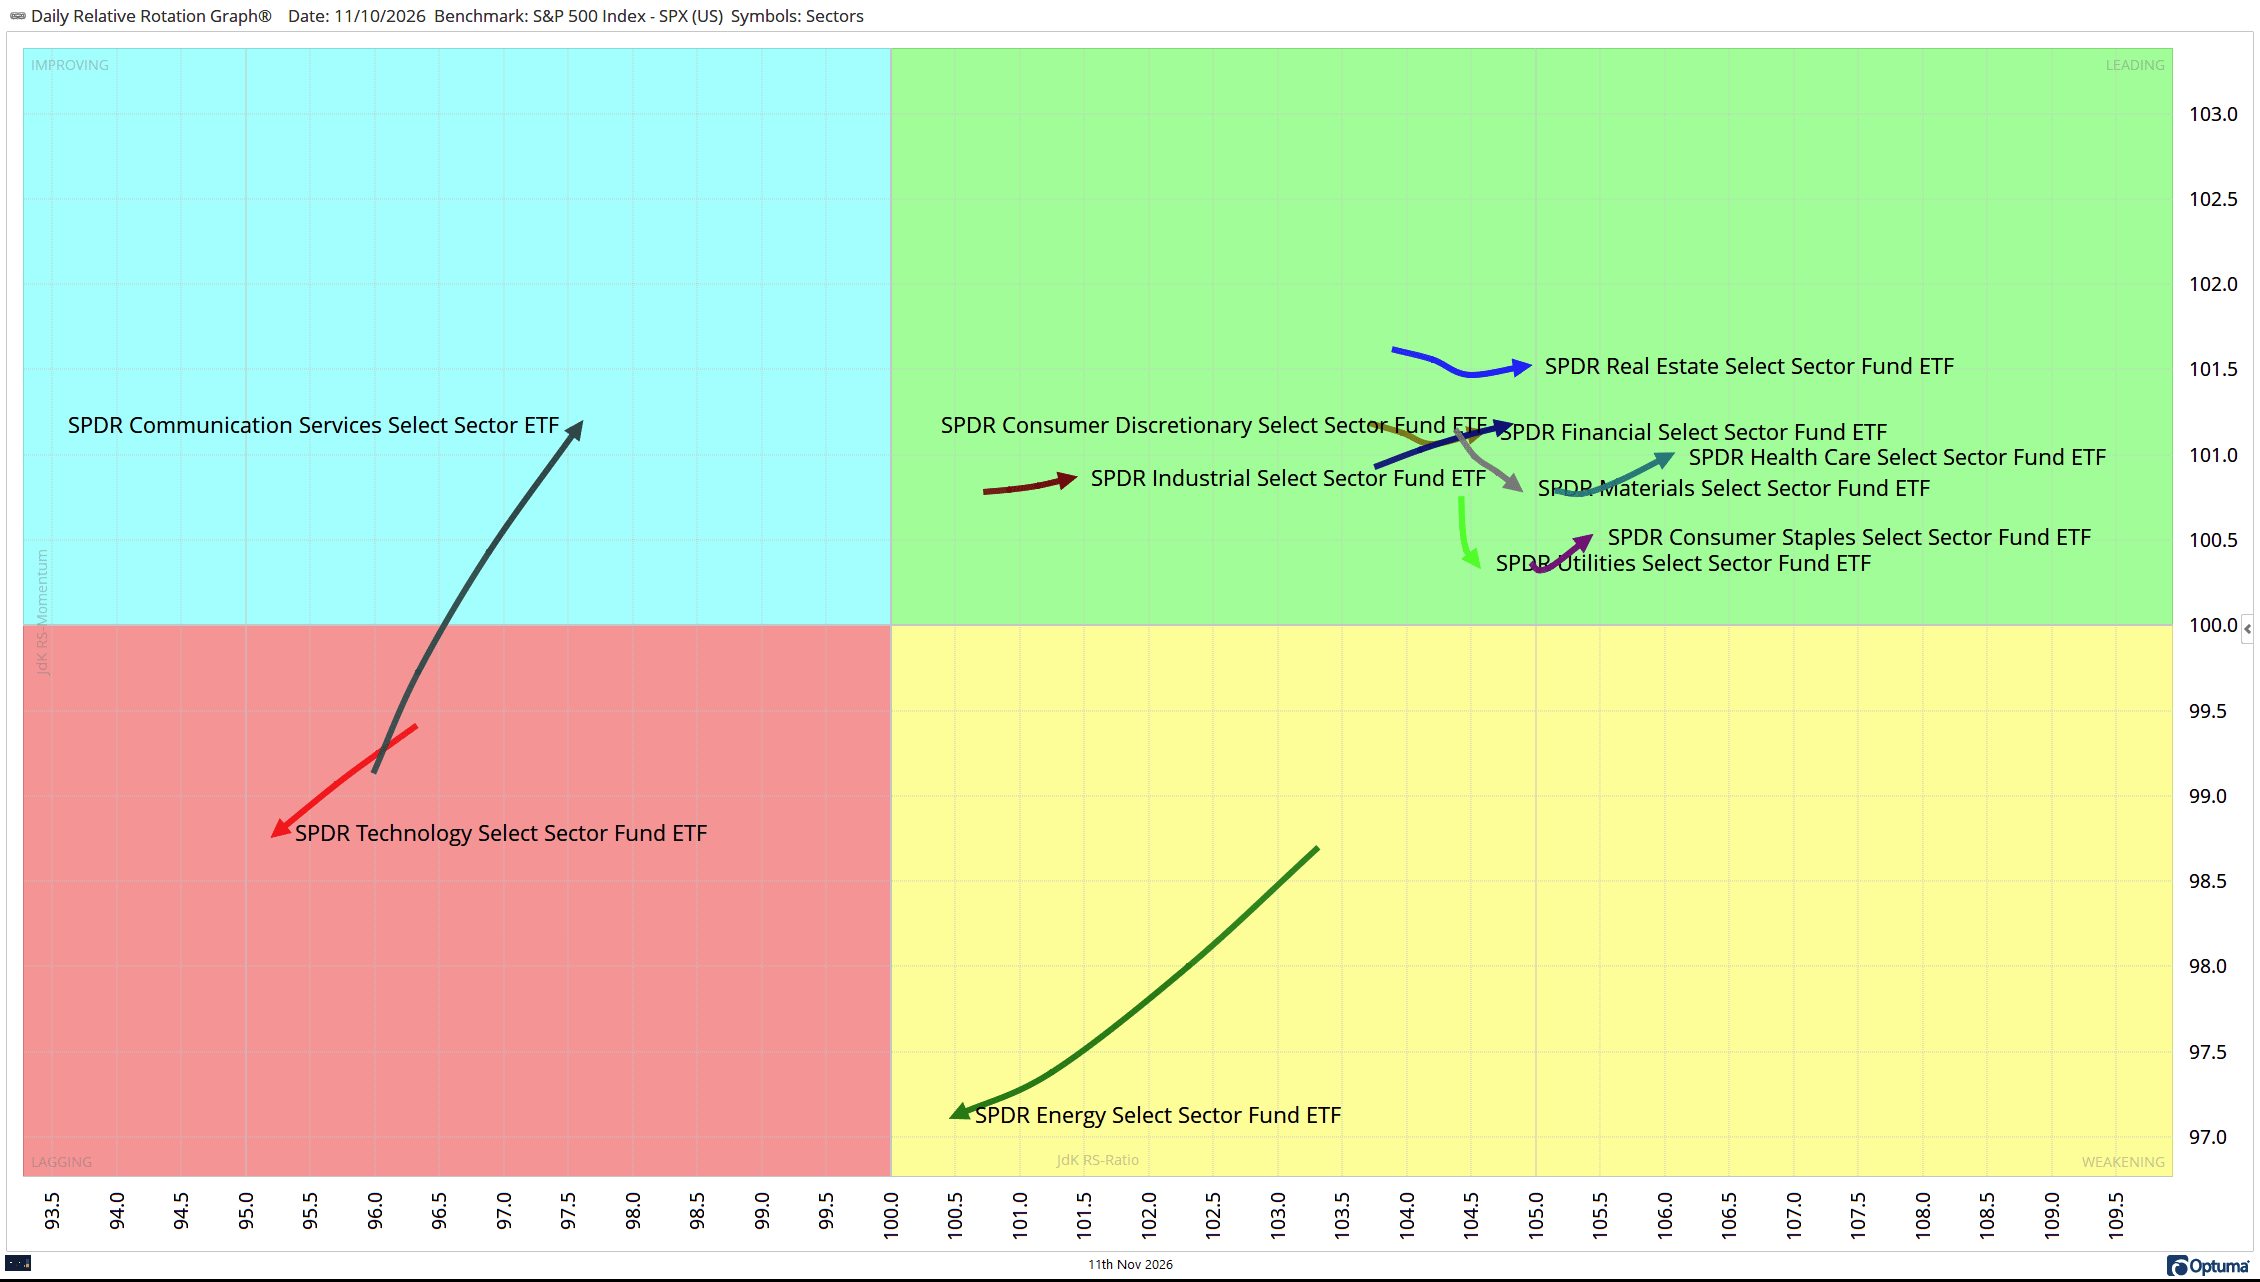
The rotation back into tech has yet to appear on the Relative Rotation Graph comparing the sectors of the S&P 500 index, but there are signs under the hood that investors may be looking for opportunities:
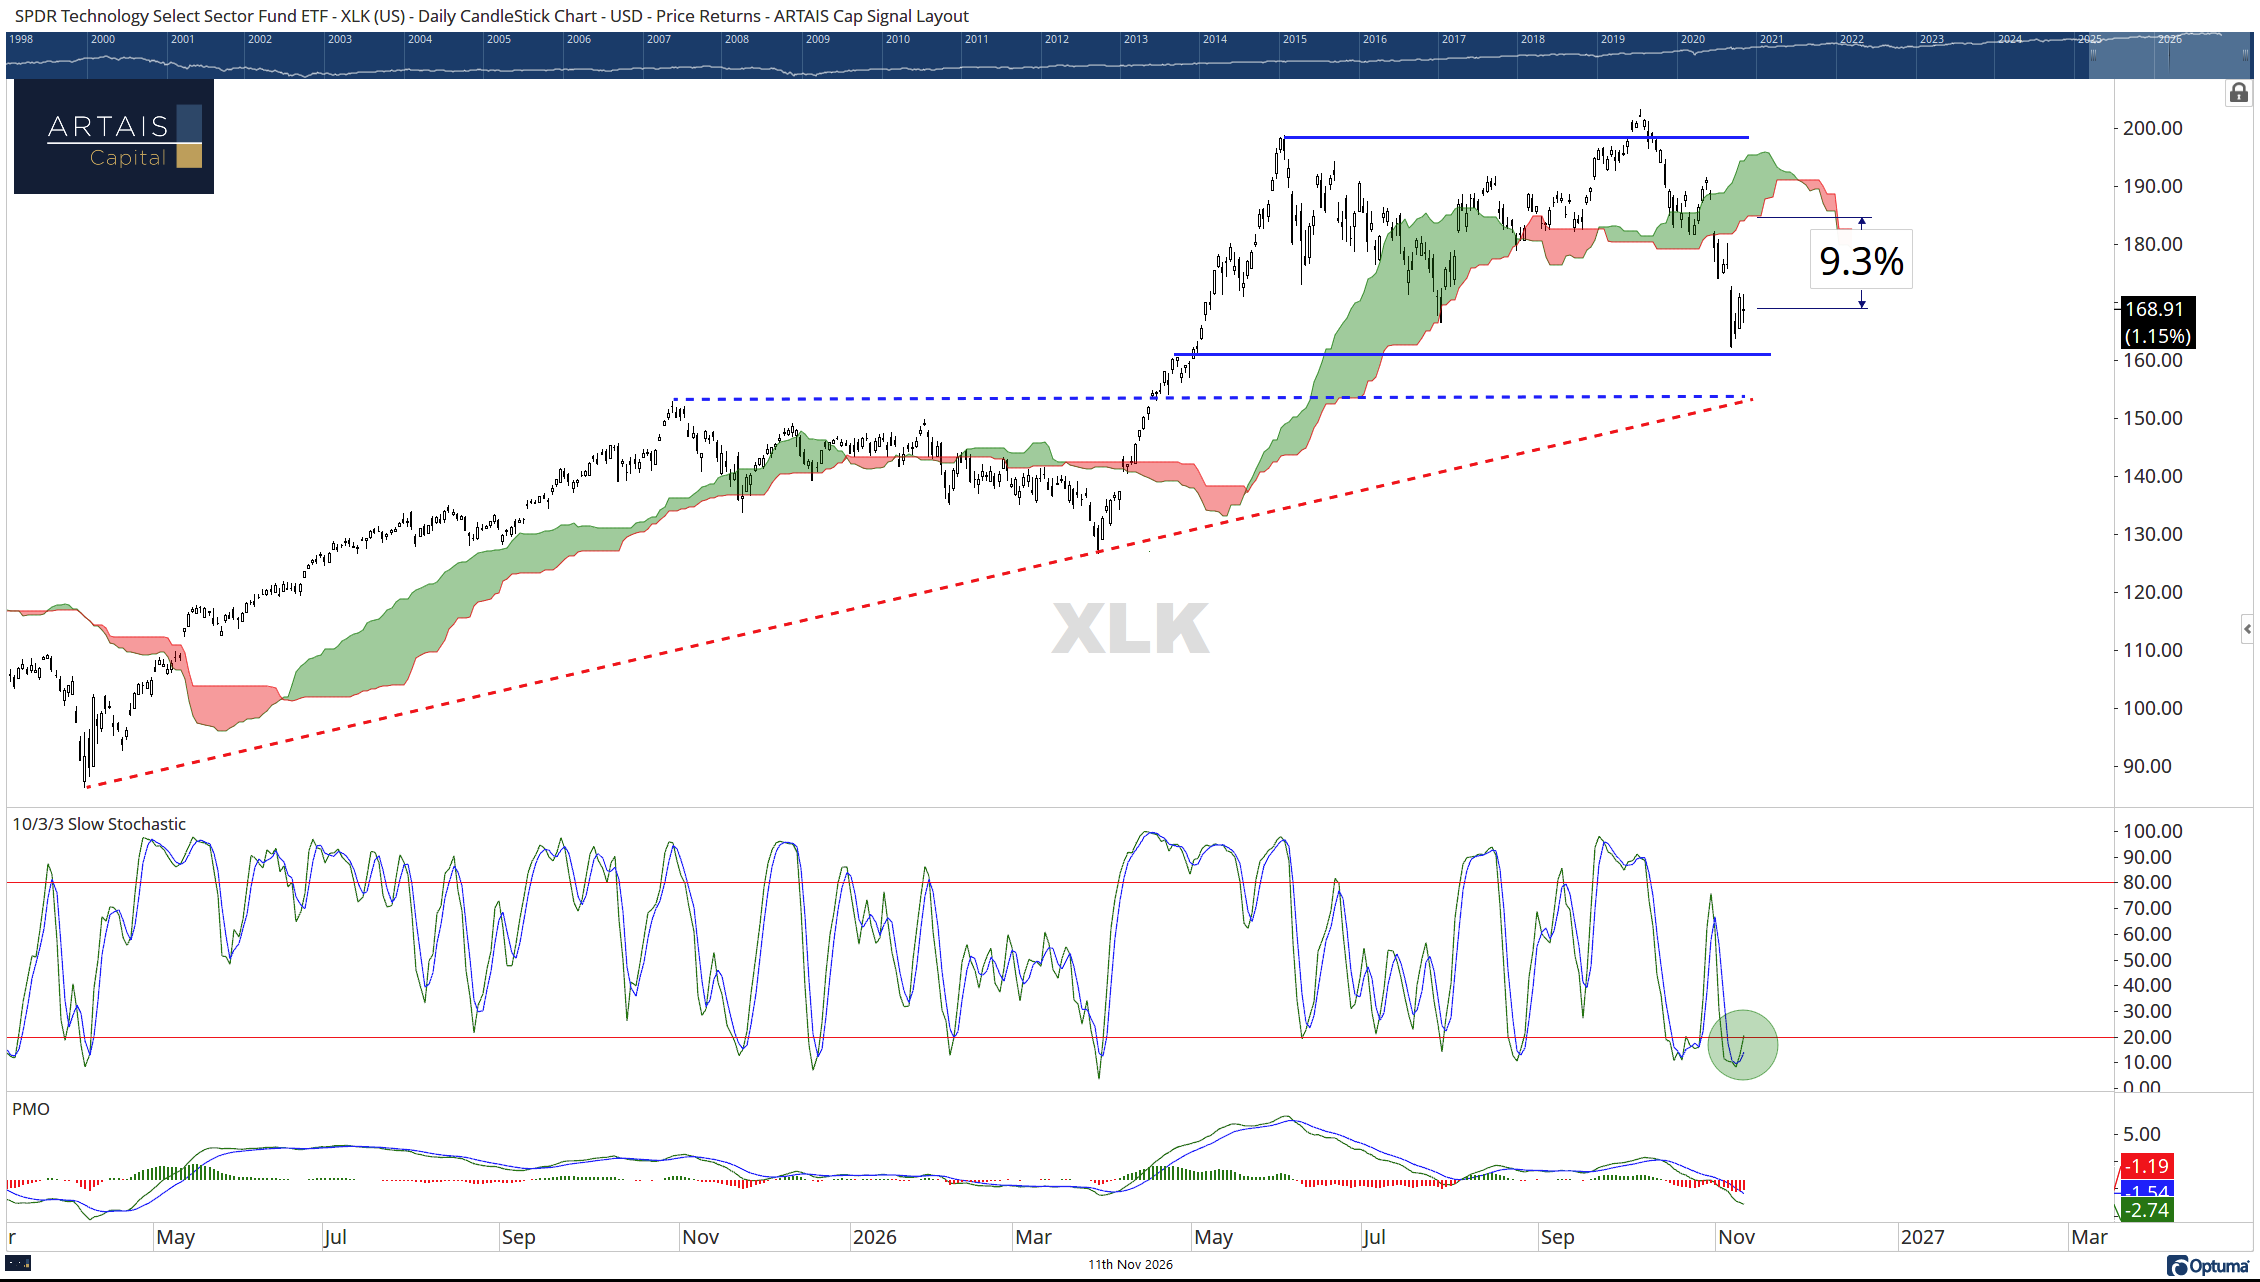
Tech stocks (using XLK as a proxy) are trading below the daily cloud, which is now overhead resistance.
The sector is oversold and starting to move back toward the cloud, which is approximately 9% higher from last night’s close:
This move higher is being confirmed by technology’s Bullish Percent Index, which has just switched back to Xs - meaning the offense is back on the field:
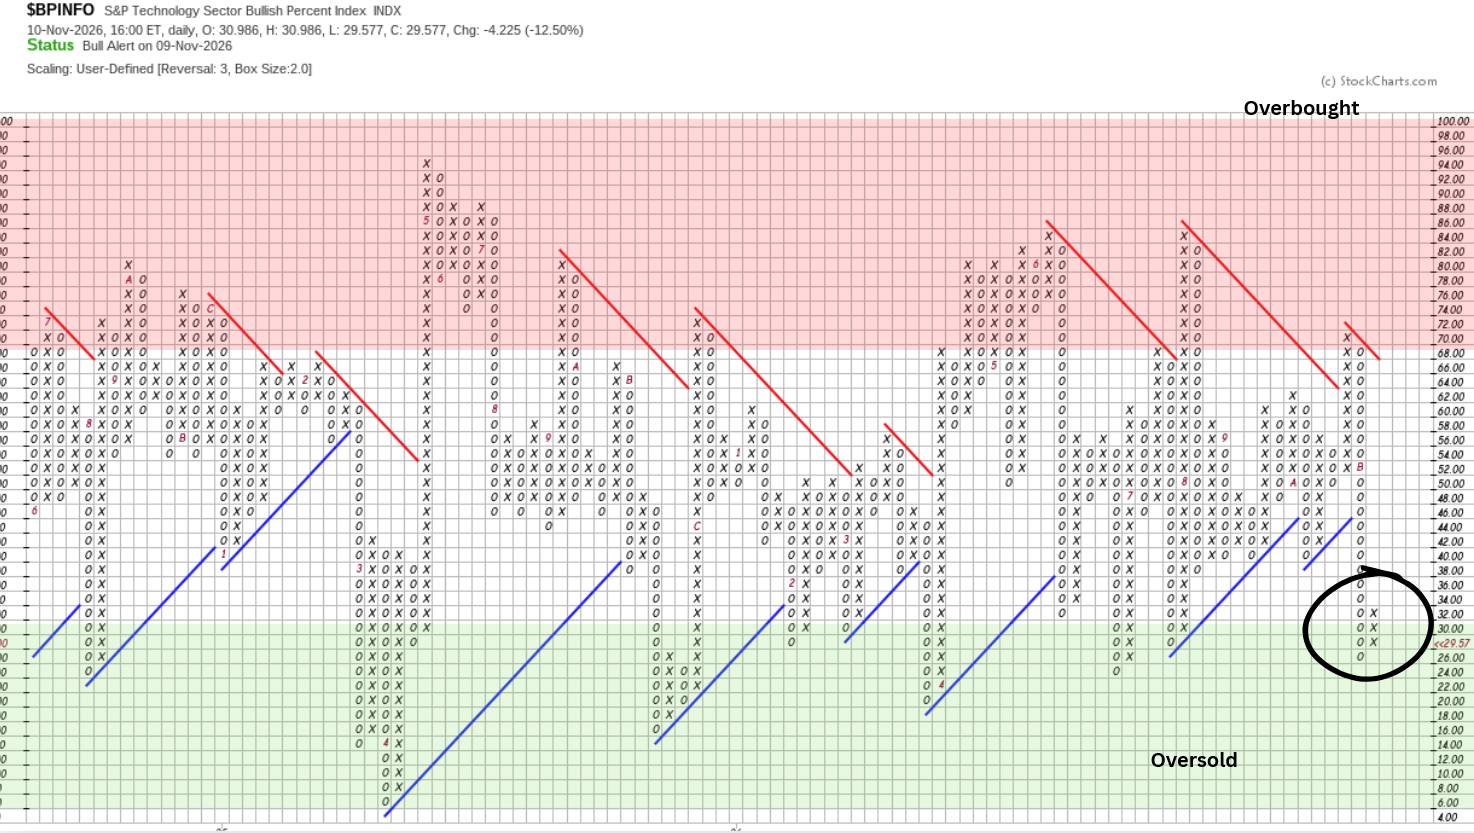
The Bullish Percent Index (BPI) is a market breadth indicator that measures the percentage of stocks within an index or sector (like the S&P 500 or NYSE) that are currently on Point-and-Figure buy signals.
Developed by Abe Cohen in the mid-1950s, the BPI ranges from 0% to 100%. Instead of just tracking the price of an index, it gives us a look under the hood at the internal strength or weakness of the market.
(Think of a column of Xs as the offense—buyers—on the field, and a column of Os as the defense—sellers.)
Semiconductors Are Testing Support
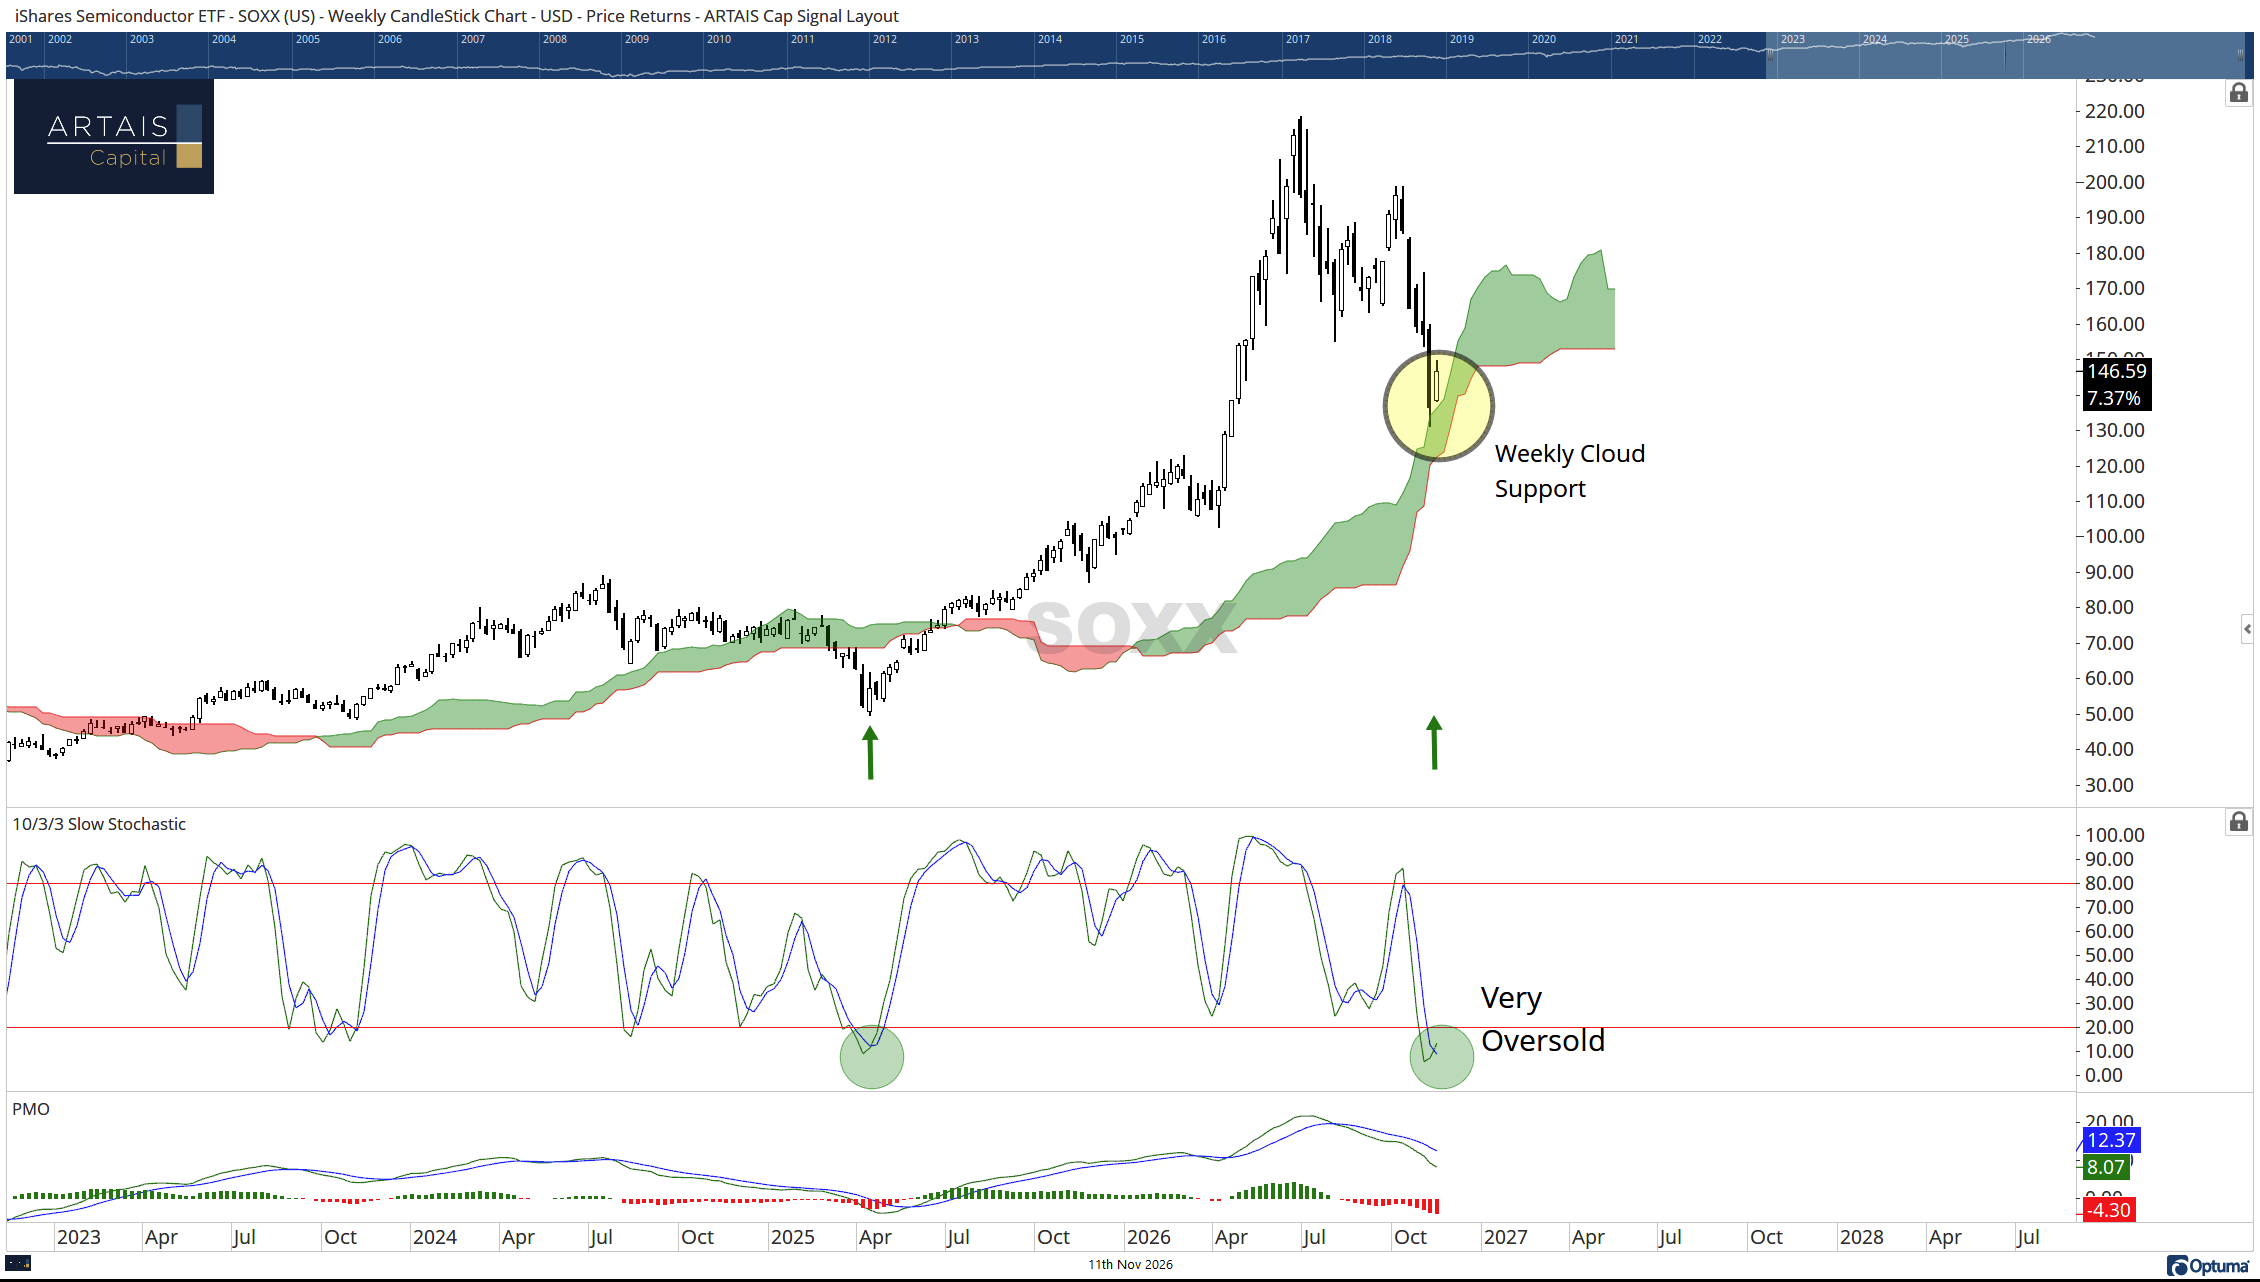
For the tech sector to regain leadership, semiconductor stocks need to start rising as well. The weekly chart of the semiconductor index (SOXX) is showing that the chip sector is finding support at the cloud and reversing back up from very oversold conditions:
New here?
The Rotation Report is a daily look at where money is moving in the market. Friday’s full report is always free.
Subscribe for free!