


Fear in the Market
This week, stocks continue to struggle as worries about the AI trade and what the Fed will do next continue to spread.
Calls for a market crash have been appearing more and more on my social media feed, which I see as a sign we are getting close to a tradable bottom.
Sentiment indicators, like the CNN Fear & Greed Index, are showing extreme levels of fear are present among investors:
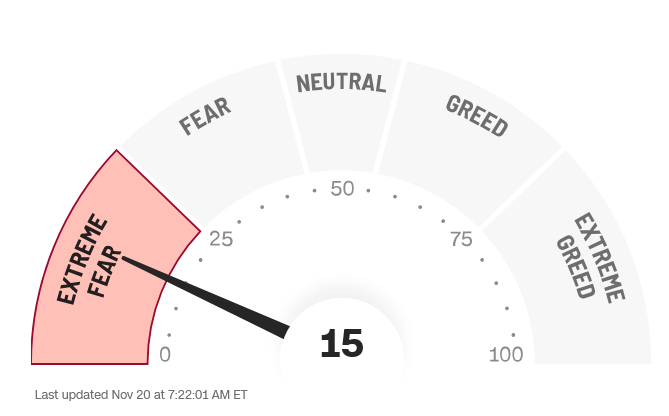
Source: CNN Fear & Greed Index
And this fear has been picked up in the bond market, especially high-yield bonds, which have been flashing warning signs since late September:
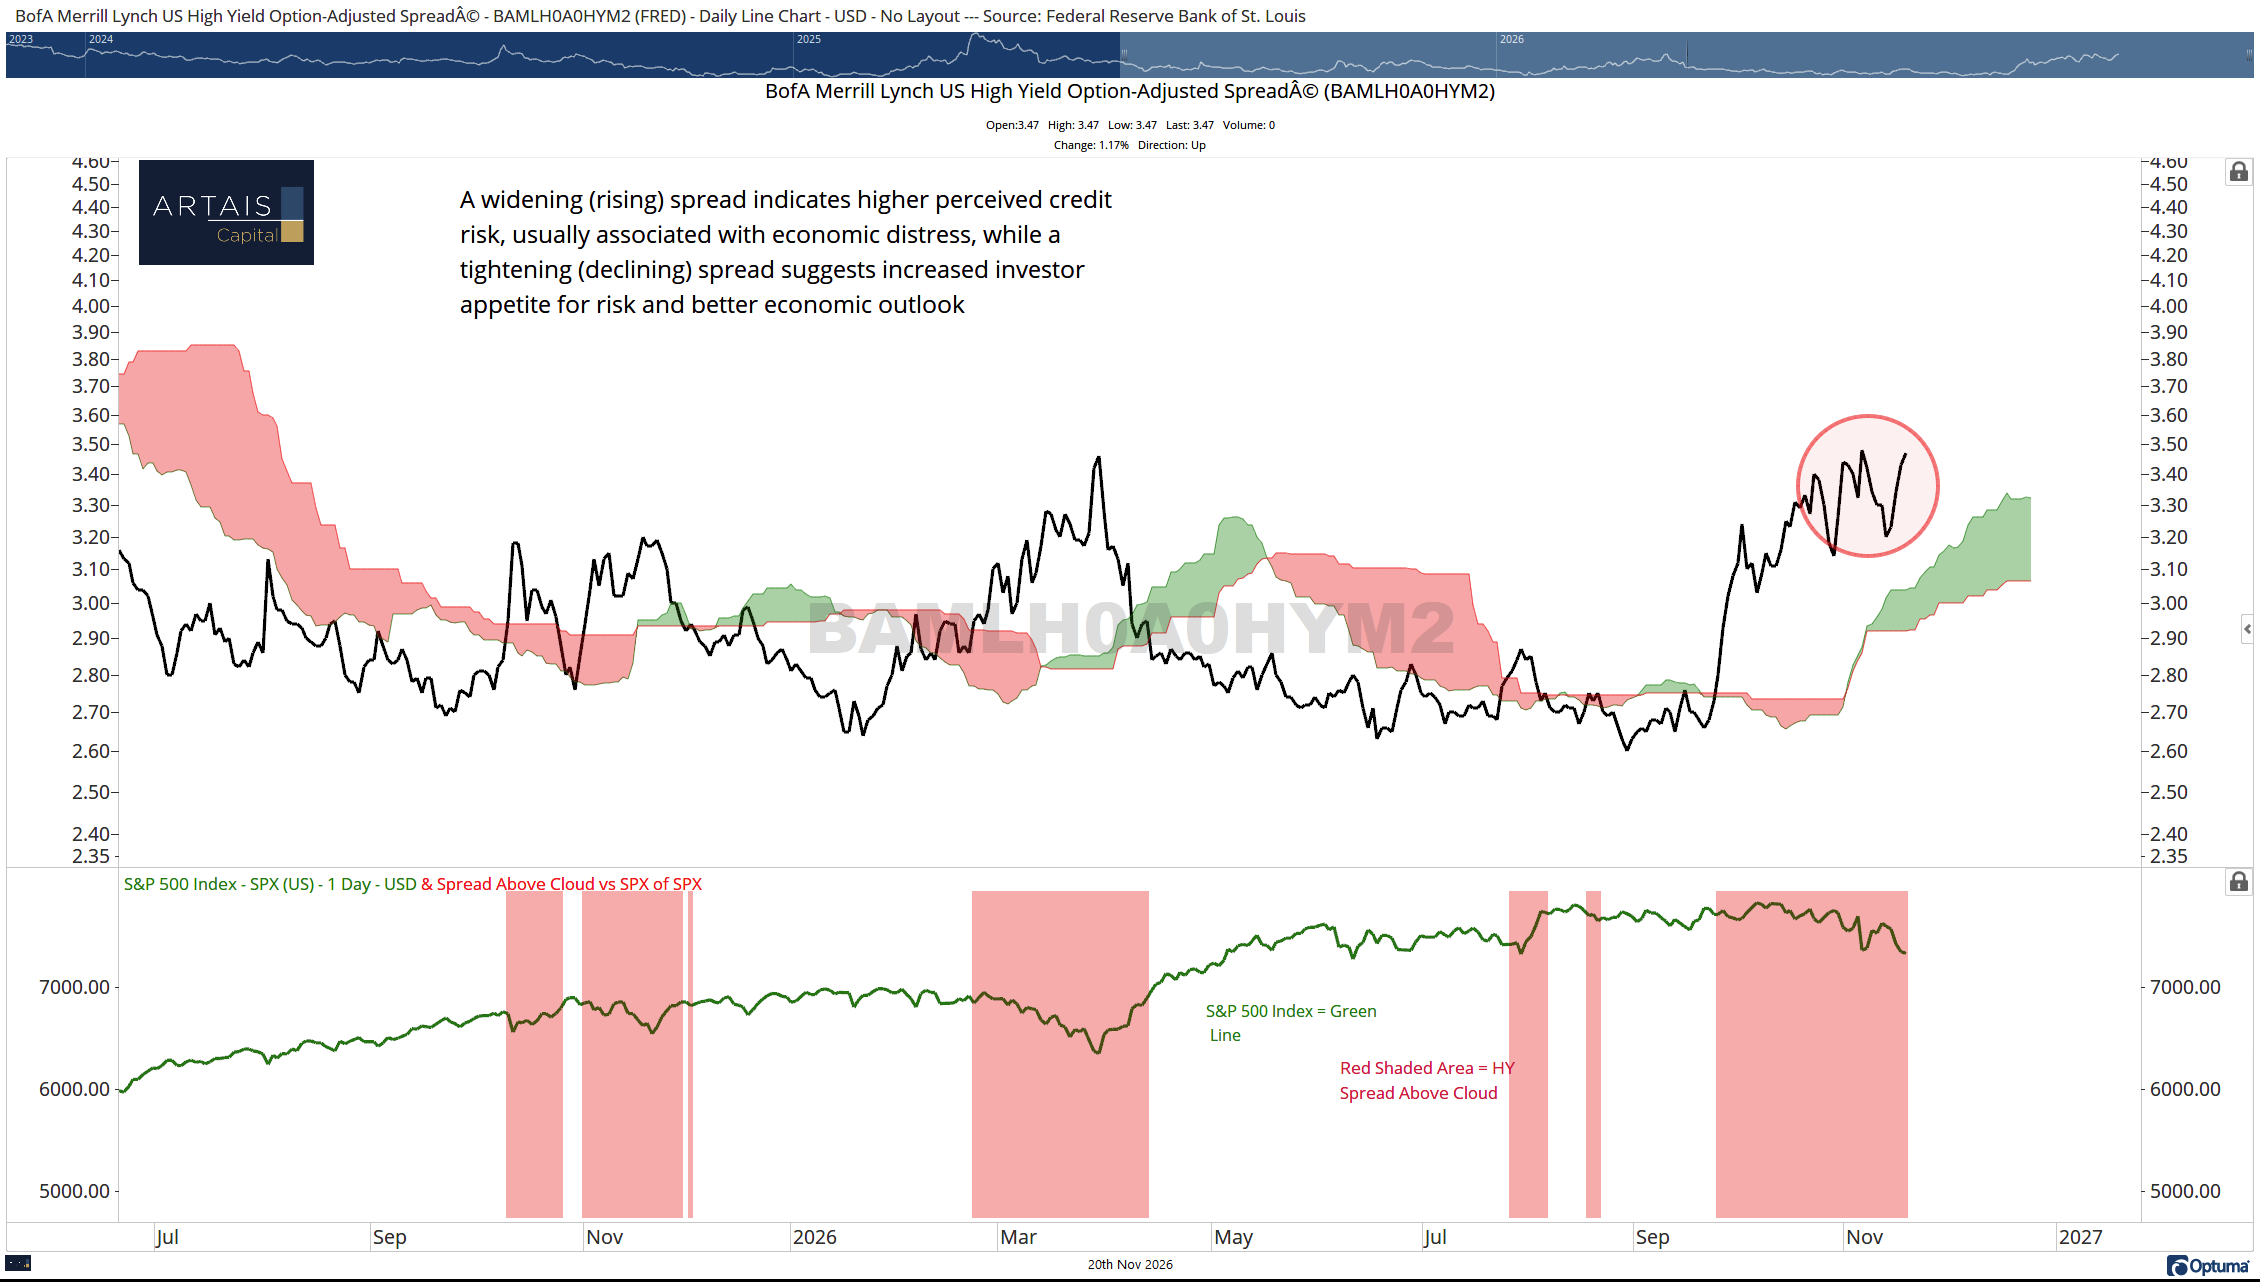
High-yield spreads continue to widen, indicating bond investors are seeing higher risk in the credit market
Spock vs Kirk
There is a field in Finance called Behavioral Finance, where investor behavior is analyzed. Research shows that investors tend to act against their best interests, especially when fear or greed overrides rational decision-making.
Which is why I think we have one more “thrust” down until the markets begin to recover.
Below is a chart of the S&P 500 index. I have marked up the chart to highlight yesterday’s break of support and the next likely targets:
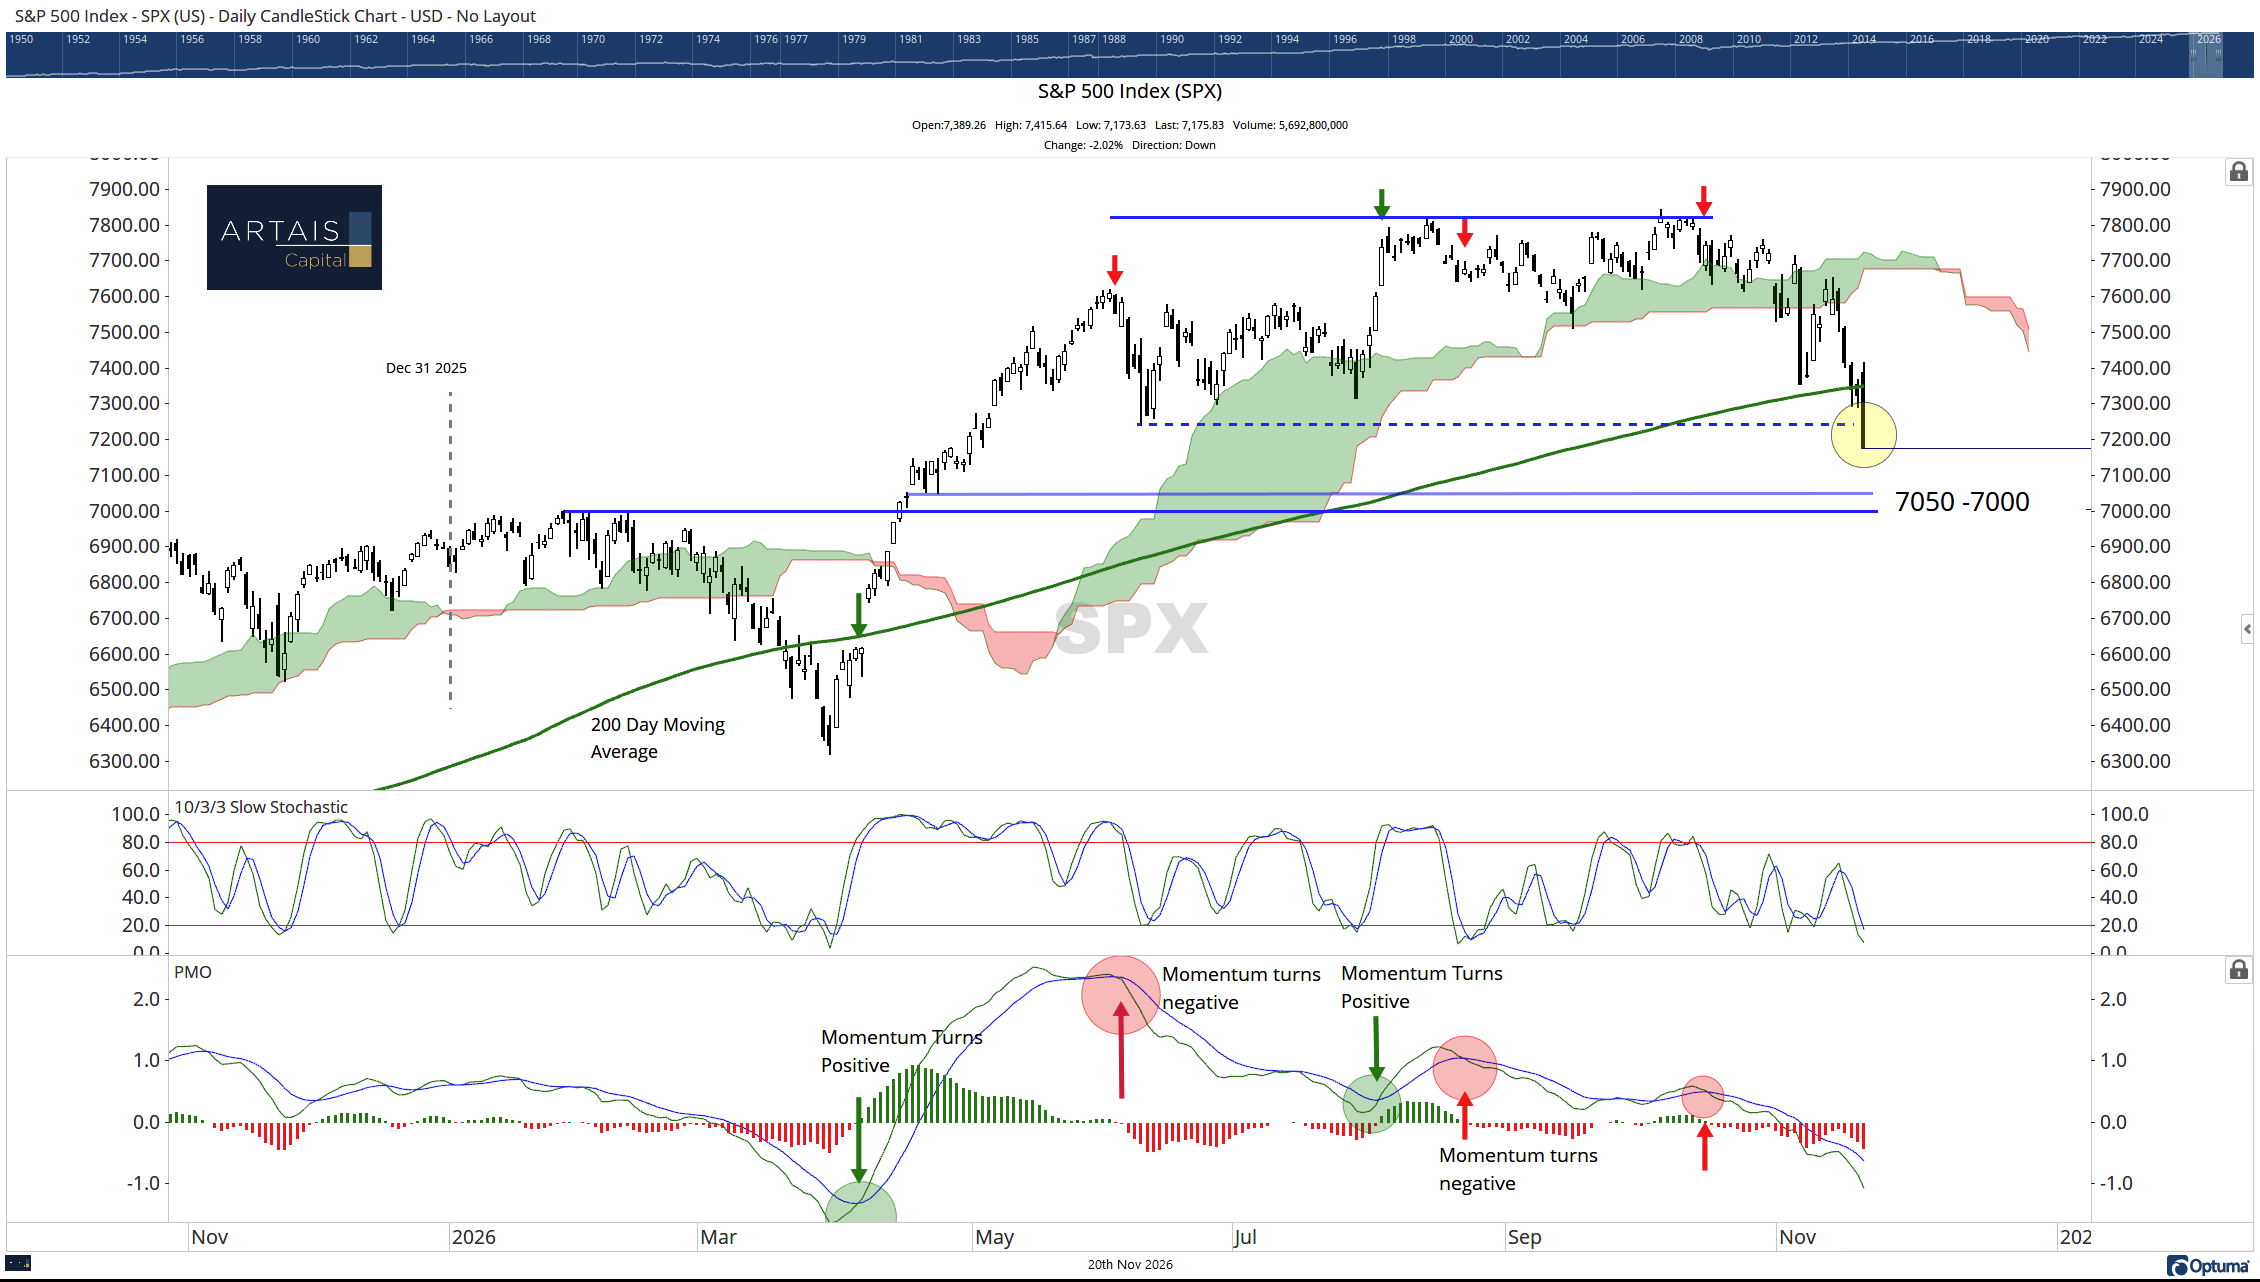
A drop to the 7000 level, roughly 2.5% lower than last night’s close, will generate headlines that the stock market just gave up its gains for the year.
This is when individuals start to talk about the market (listen for conversations about the market during Thanksgiving), and individual investors who normally don’t follow the market closely start to worry and possibly make changes to their portfolios that may hurt them in the long run.
For example, moving a 401k to cash, then moving it back into the market after the market has risen back to previous highs.
So what am I looking for to indicate that the bottom is in?
One of the indicators I use to help me determine if I should be risk-on or risk-off is high-yield bonds. High-yield bonds are one of the riskier asset classes in the bond market.
As I have mentioned in the past, I view stock investors as Captain Kirk from Star Trek - full of emotions.

While bond investors are more like Mr. Spock, their decisions are more logical.

When bond investors start to move out of high-yield bonds, it is an indication that the math doesn’t make sense, and high-yield bonds need to be repriced with a higher yield to compensate for the higher level of risk that is present in the current economic environment.
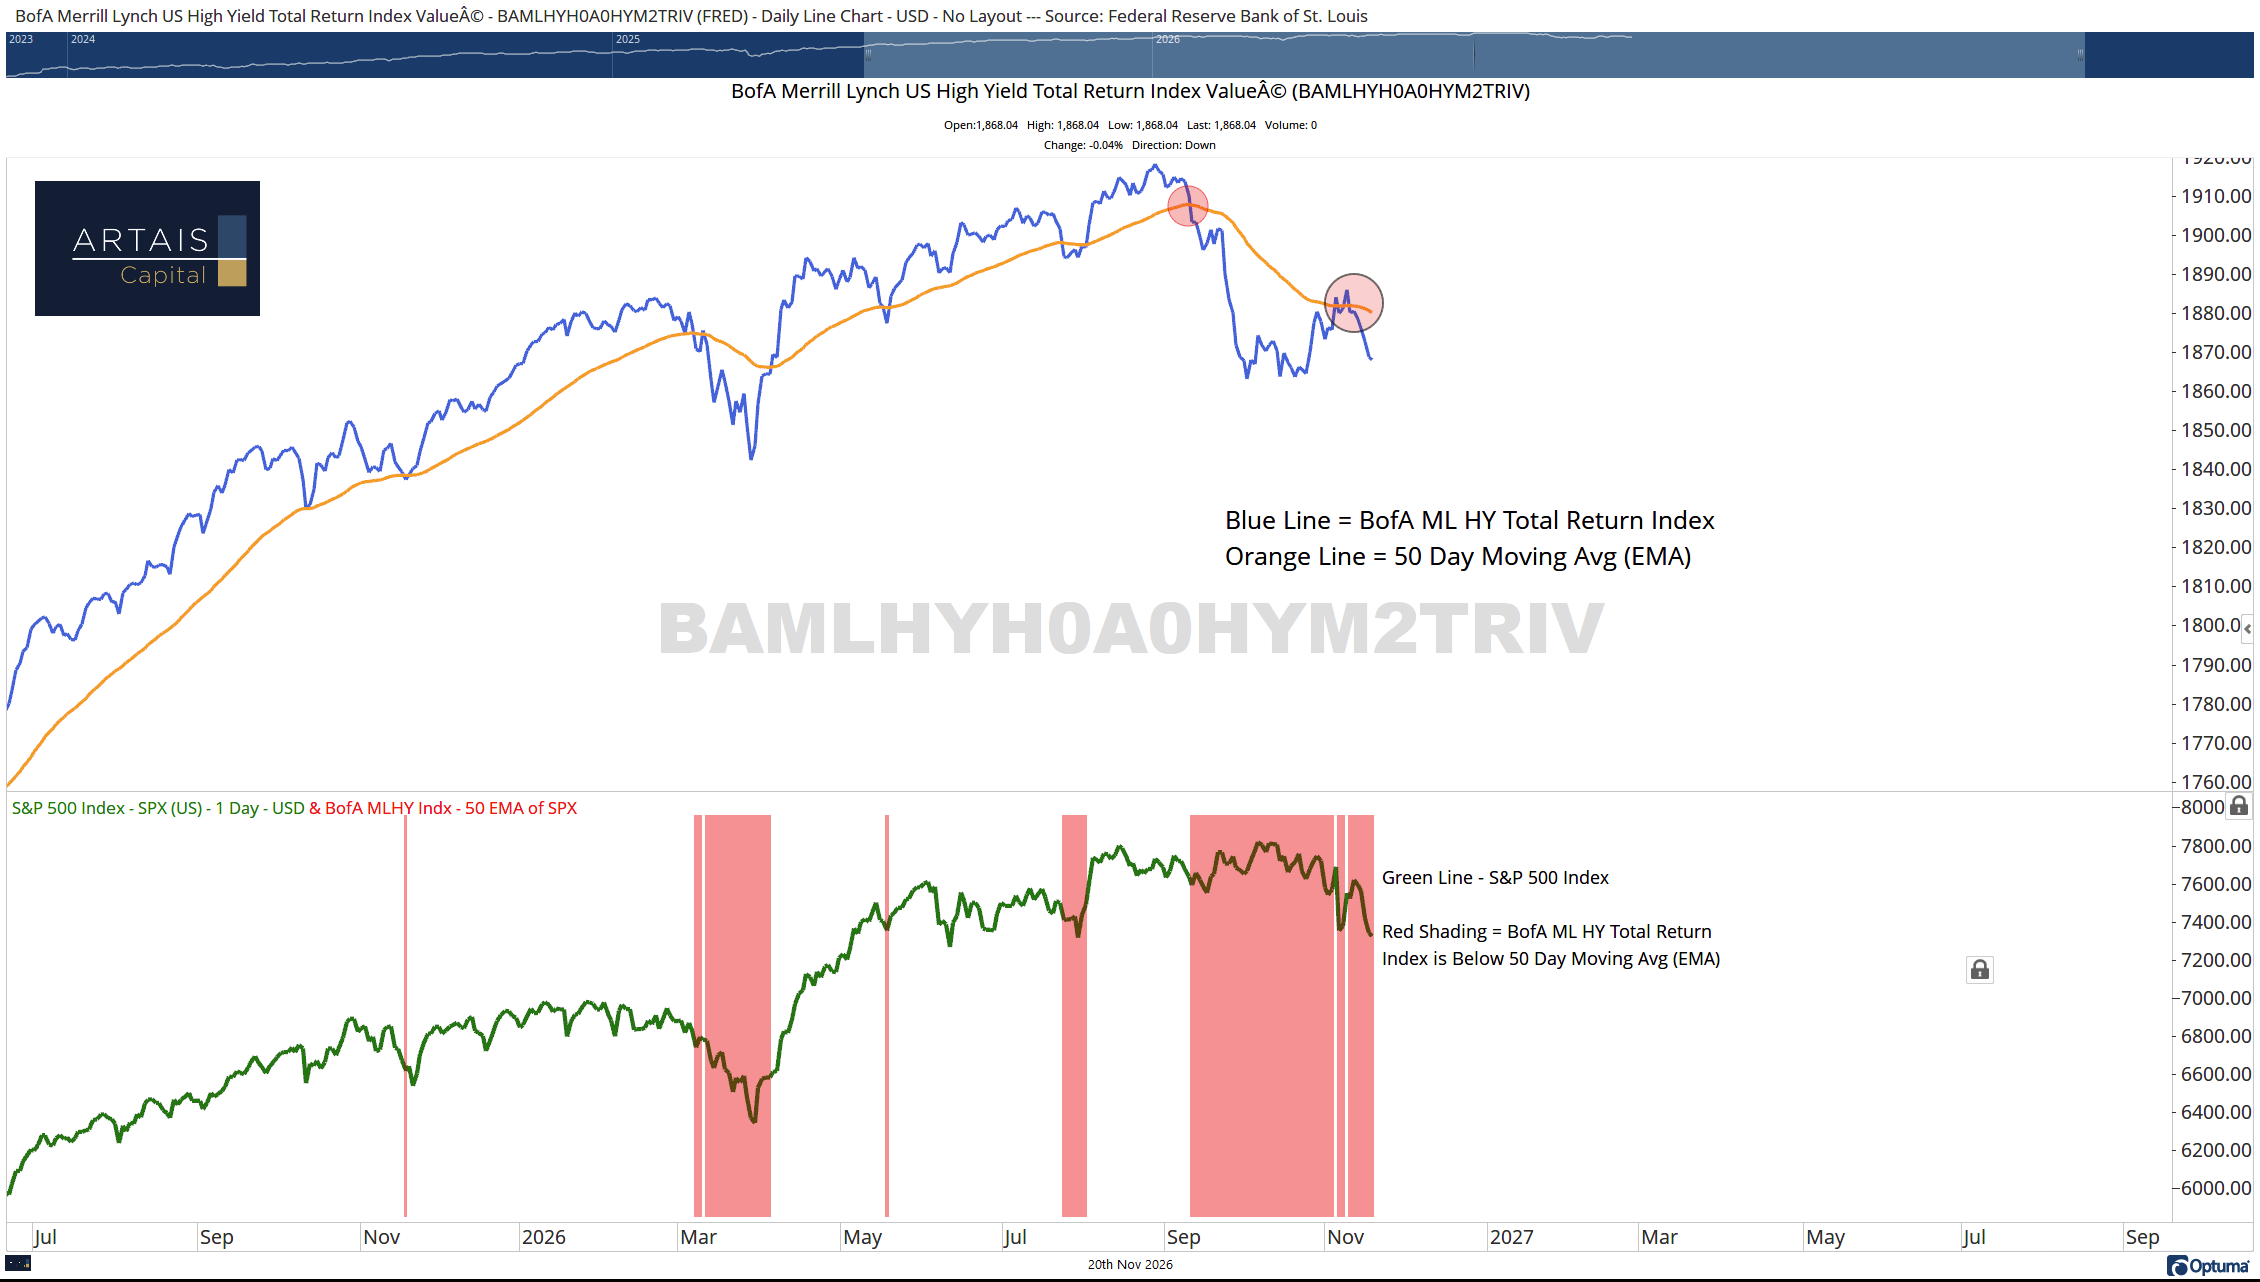
So before I move back into risk-on mode, I want to see the “logical” side of the market start to view high-yield bonds as an opportunity, meaning they think yields are now too high in the current environment.
This change in opinion will show up when the high-yield bond index begins to rise:
Rotation into High Beta
Another change I want to see, which interestingly has been occurring during this week’s decline, is the rotation away from low-volatility stocks and back into high-beta stocks.
When market participants are feeling bullish, they tend to focus on higher-beta names (like tech stocks) in order to capture upside price volatility.
Below is a Relative Rotation Graph that compares the momentum and relative strength of growth and high-beta stocks vs. value and low-volatility stocks.
One might expect to see momentum and relative strength of high-beta stocks weakening, but just the opposite has been occurring this week:
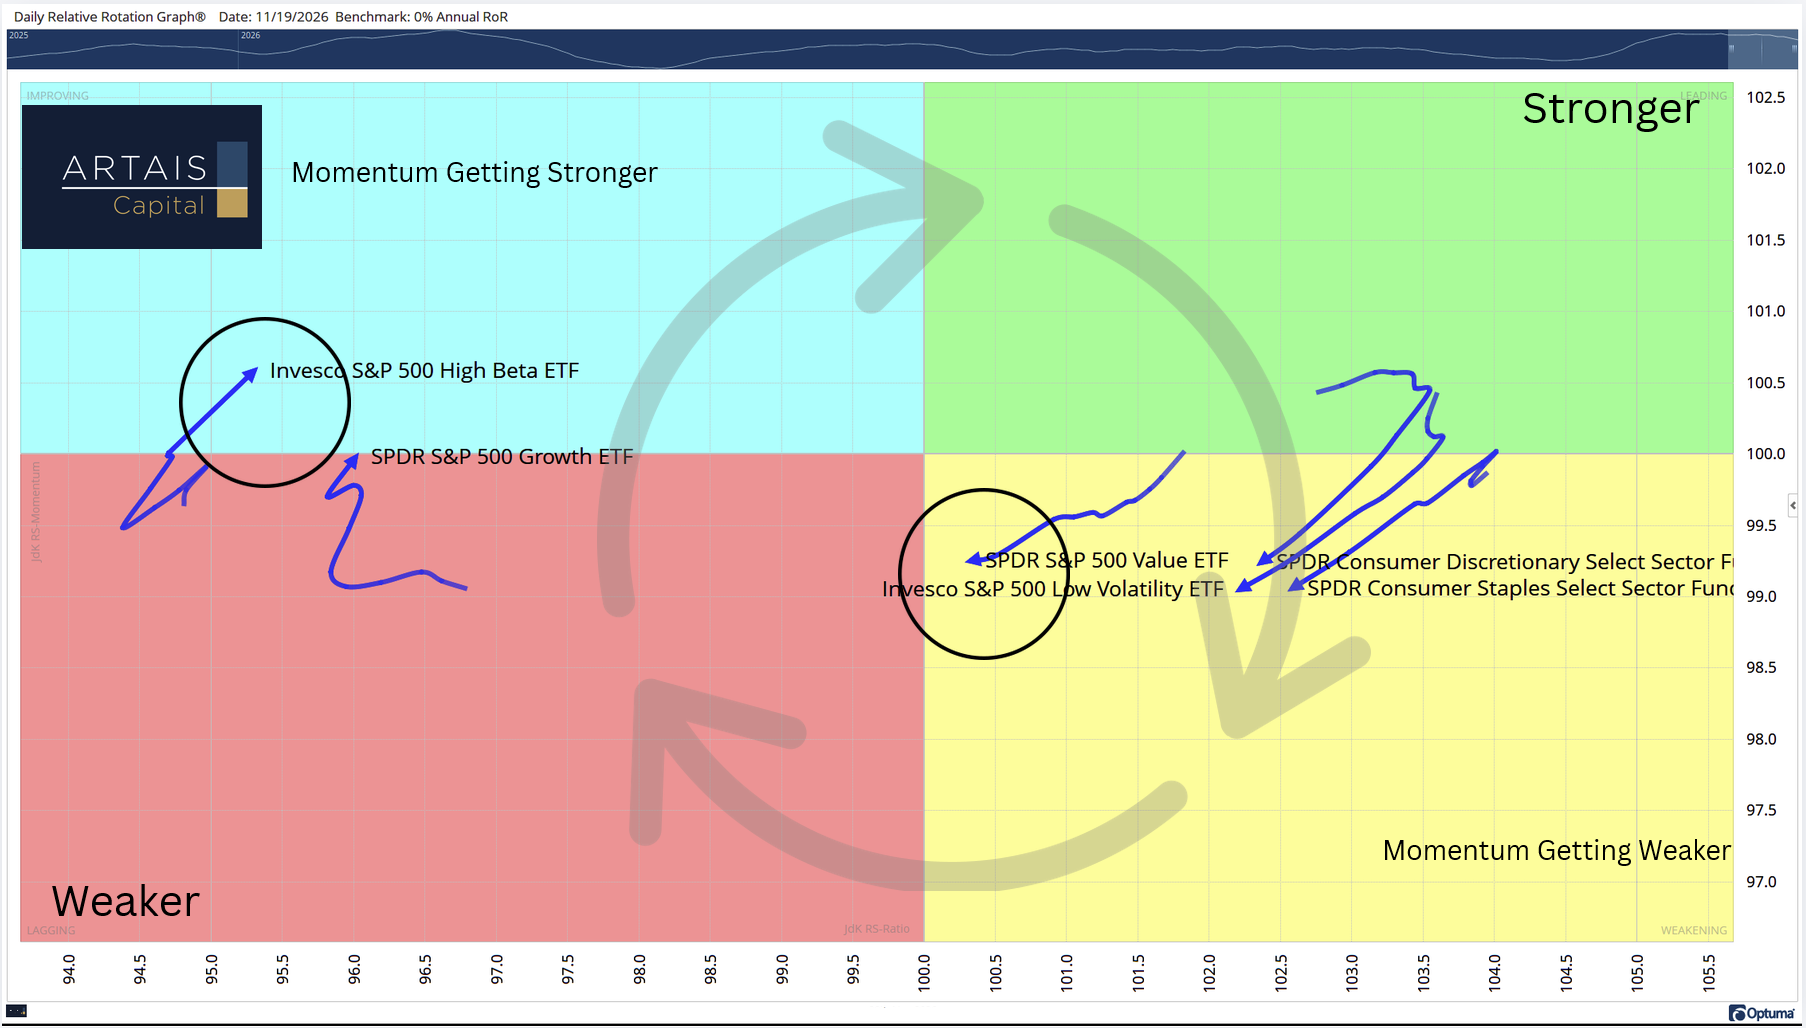
This is an indication that bargain hunting may be beginning, especially if these bargain hunters believe the current volatility in the market is short-term.
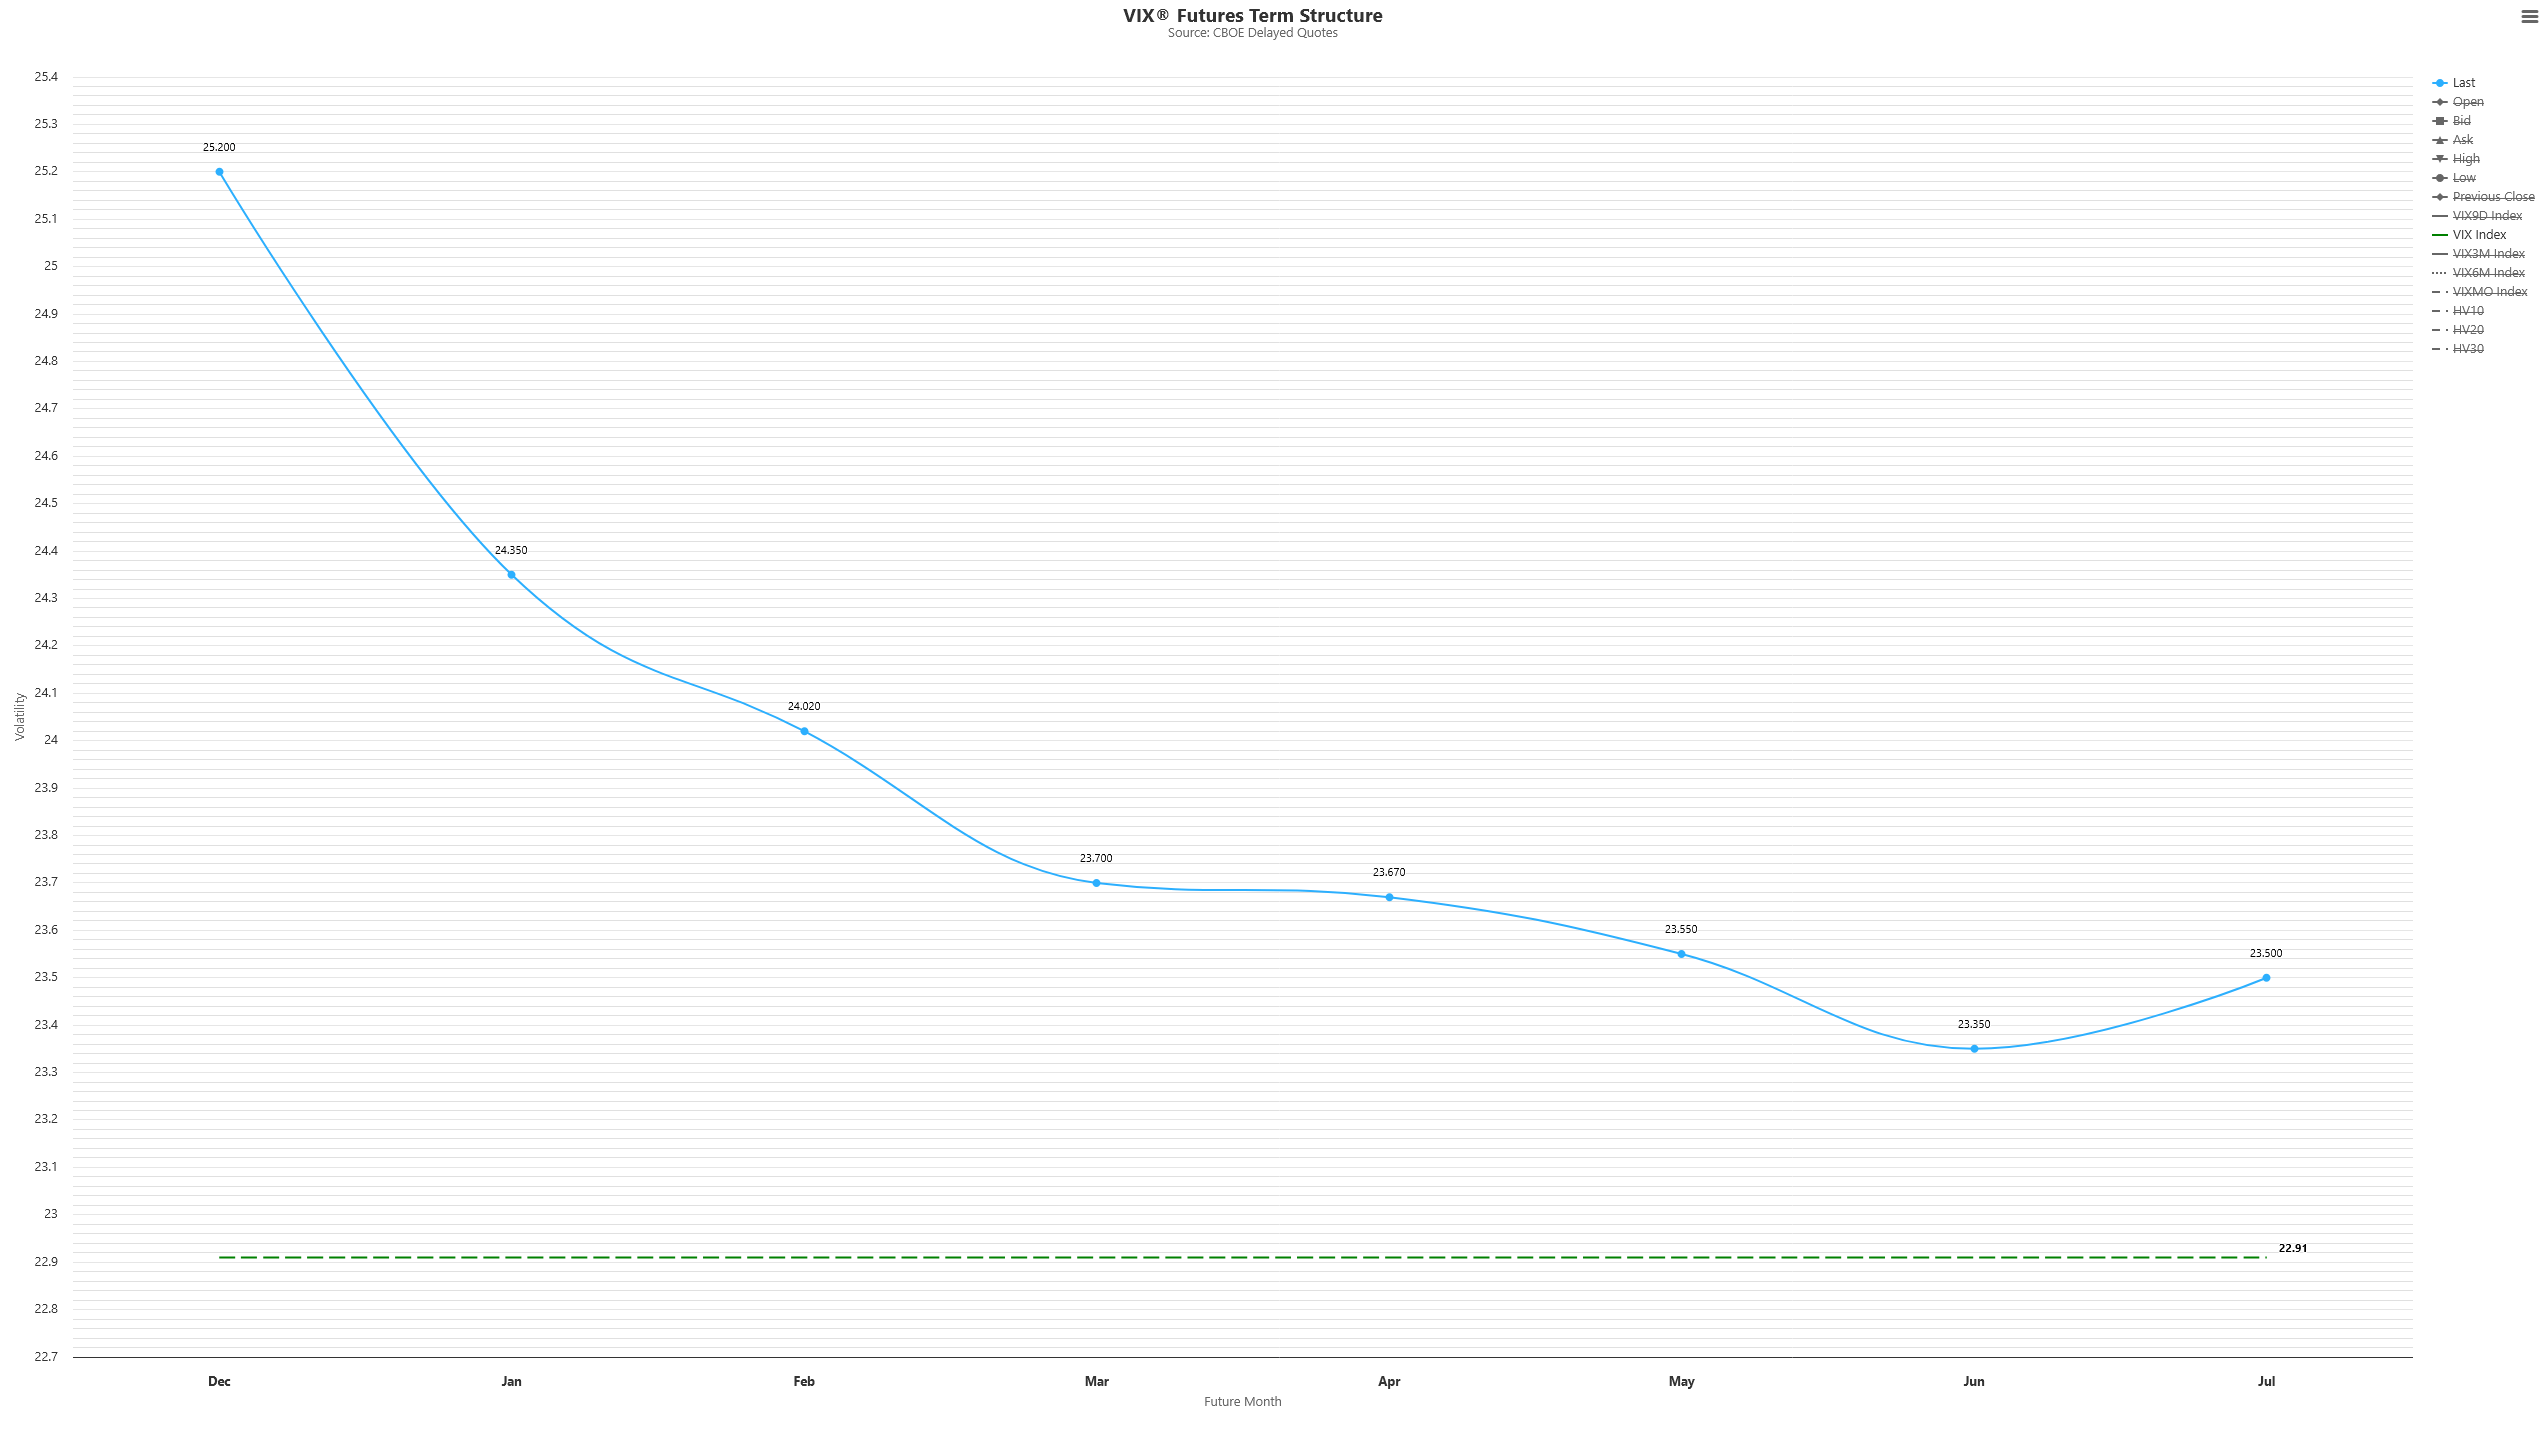
Which is what is being indicated by the VIX contract. Below is the VIX term structure, which shows the expected volatility of the S&P 500 across different time periods.
If you notice, traders are expecting a drop in volatility:
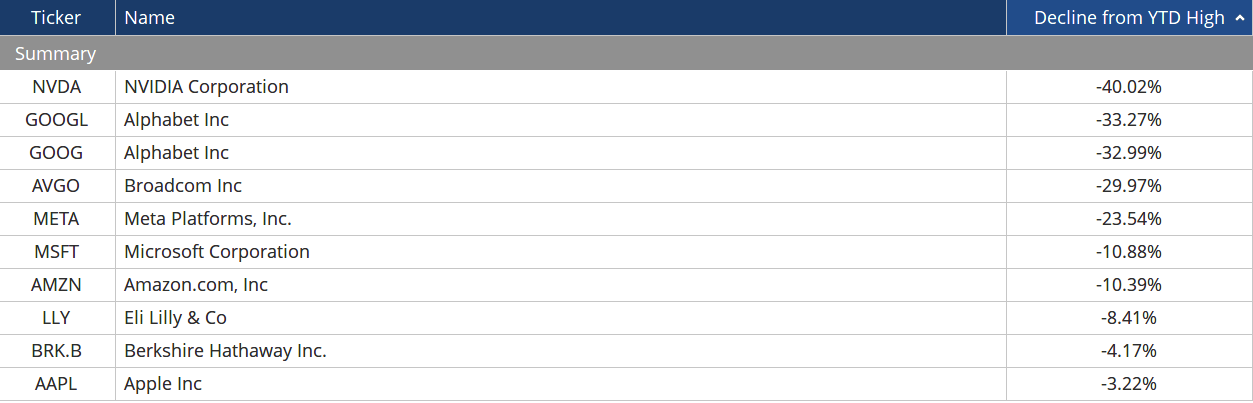
Investors who are looking 6 months or longer into the future may be looking at the large declines in tech stocks as an opportunity:
What Are The Top 10 Stocks Doing?
The top ten stocks in the S&P 500 index are mostly high-beta, tech names, and these ten stocks make up approximately 36% of the index:
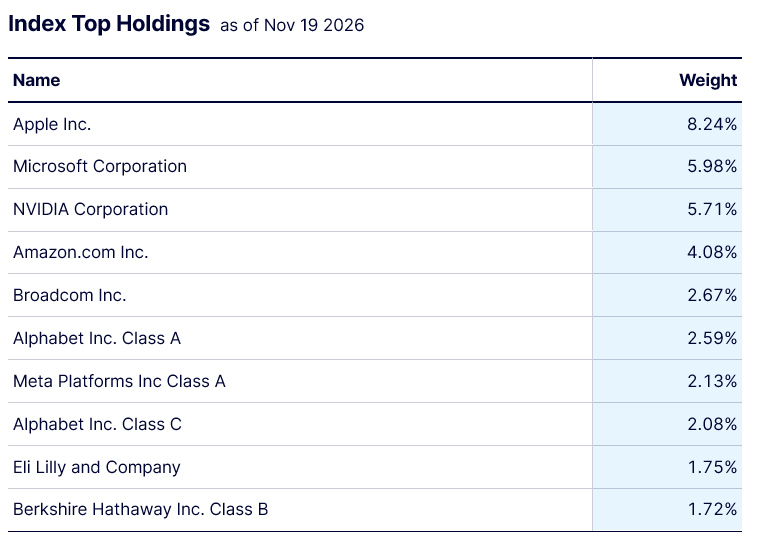
Source: State Street
Watching these stocks can give us some better insight into whether bargain hunting in high-beta names is occurring.
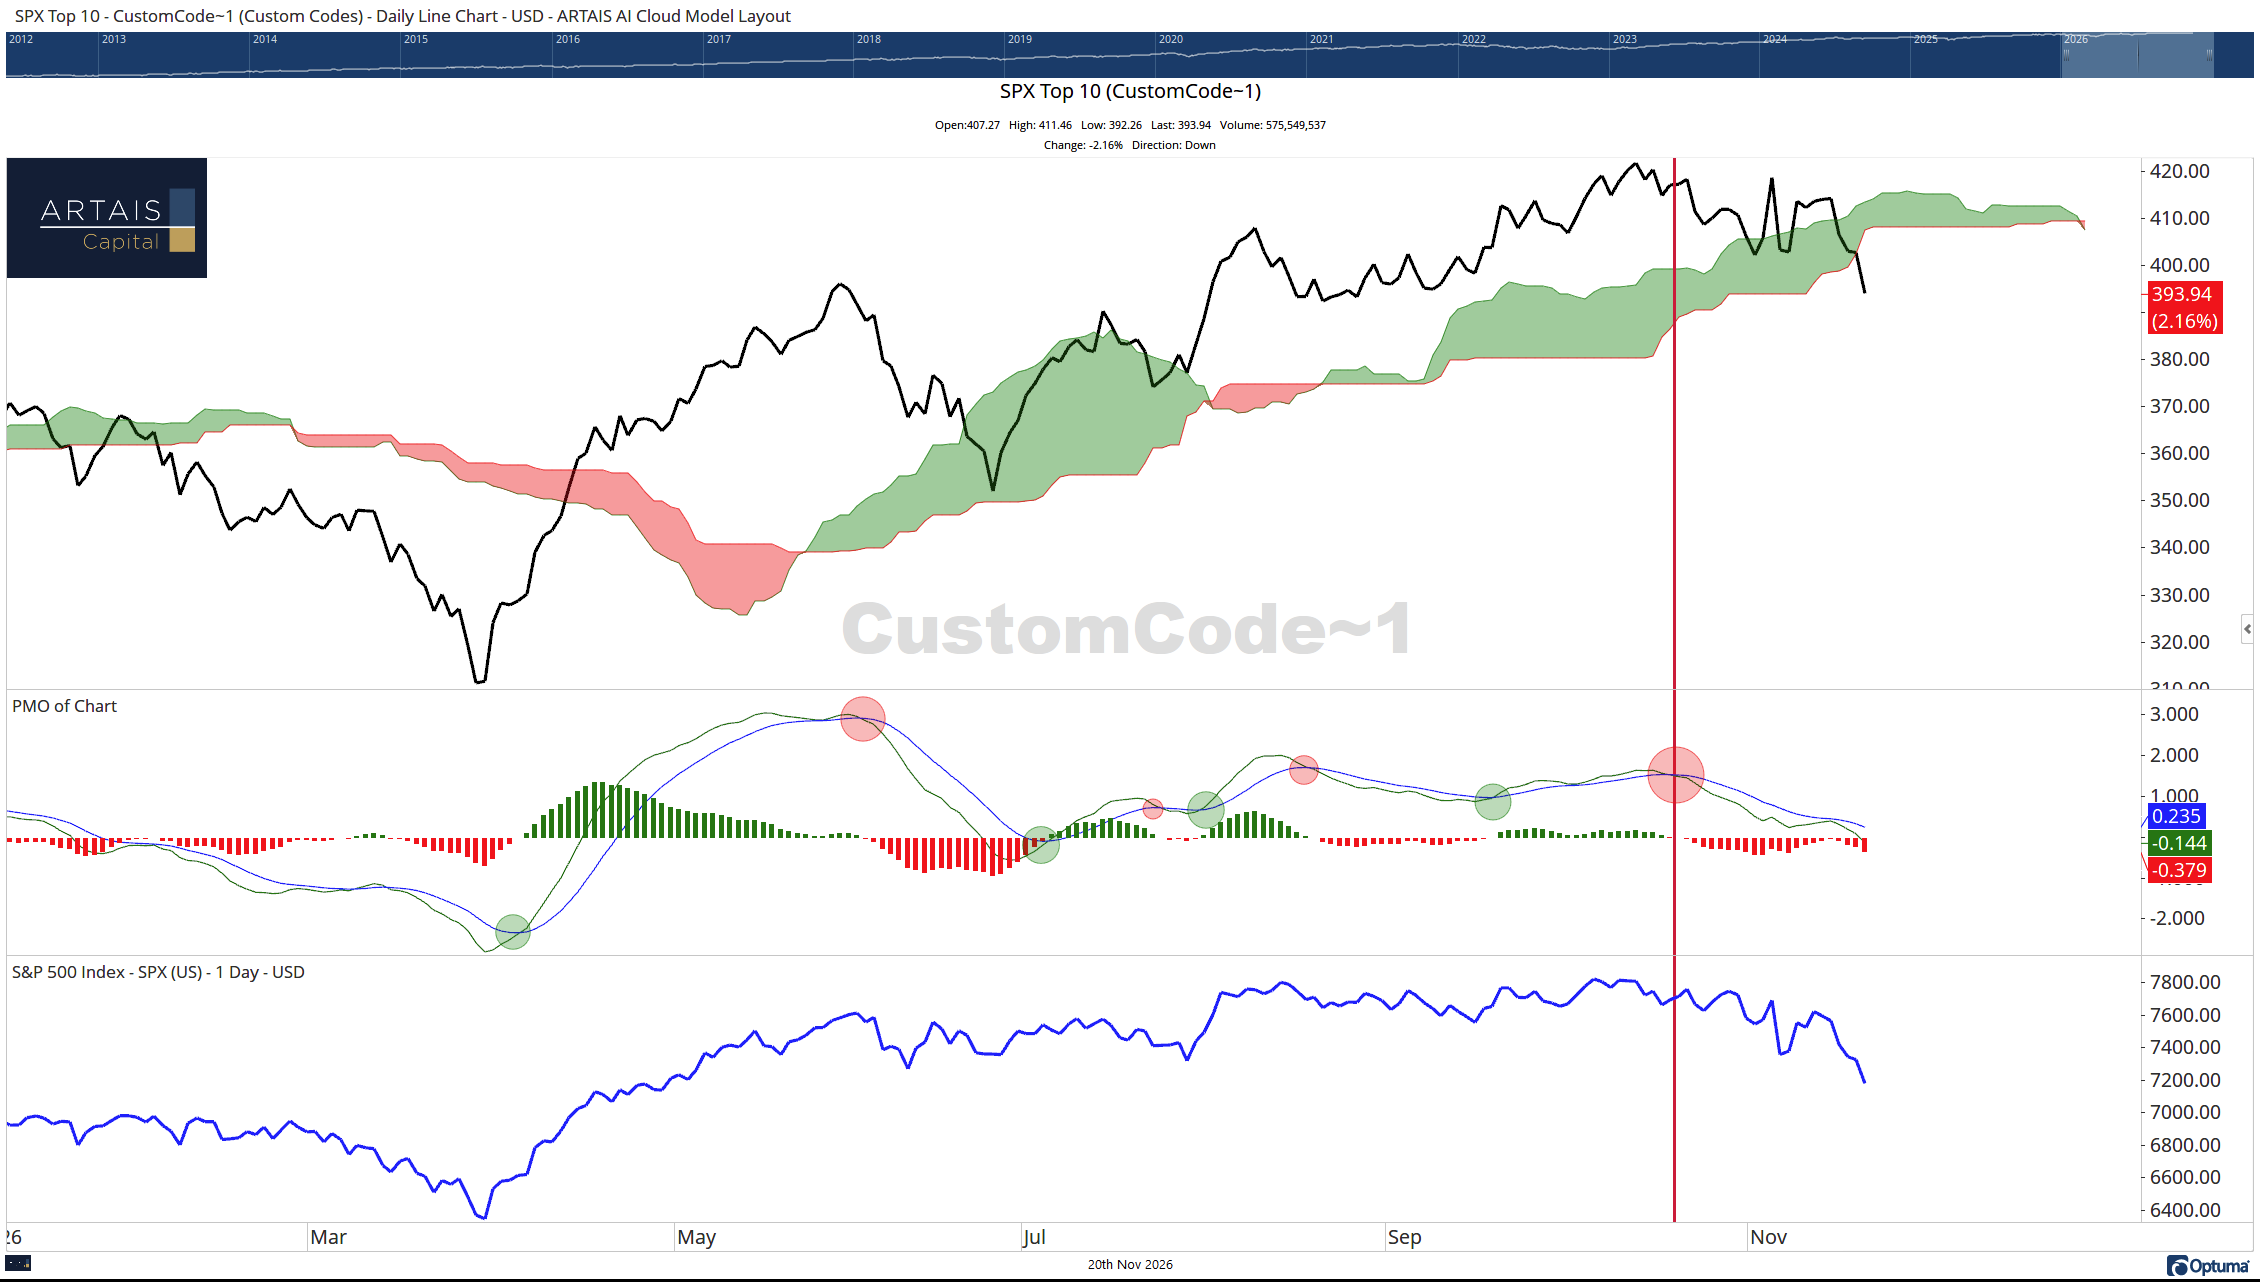
Below, I’ve created an index of the current top 10 holdings in the S&P 500, re-weighted to match their weighting in the S&P 500.
I am watching for a changeover in momentum in the top ten group, and eventually a resumption of the trend, meaning the group begins to trade above the Ichimoku cloud:
Summary
While some of the underlying rotation in momentum and relative strength among high-beta stocks is indicating that some bargain hunting may be starting, I am waiting for additional signals, such as a rise (lower yield) in high-yield bonds and a sustained rotation back into tech stocks.
I will leave you with an old Wall Street saying that a colleague reminded me of last night:
“Thanksgiving belongs to the bears, and Christmas belongs to the bulls”
Thanks for reading, and have a great weekend!
John Rothe, CMT
New here?
The Rotation Report is a daily look at where money is moving in the market. Friday’s full report is always free.
Subscribe for free!